
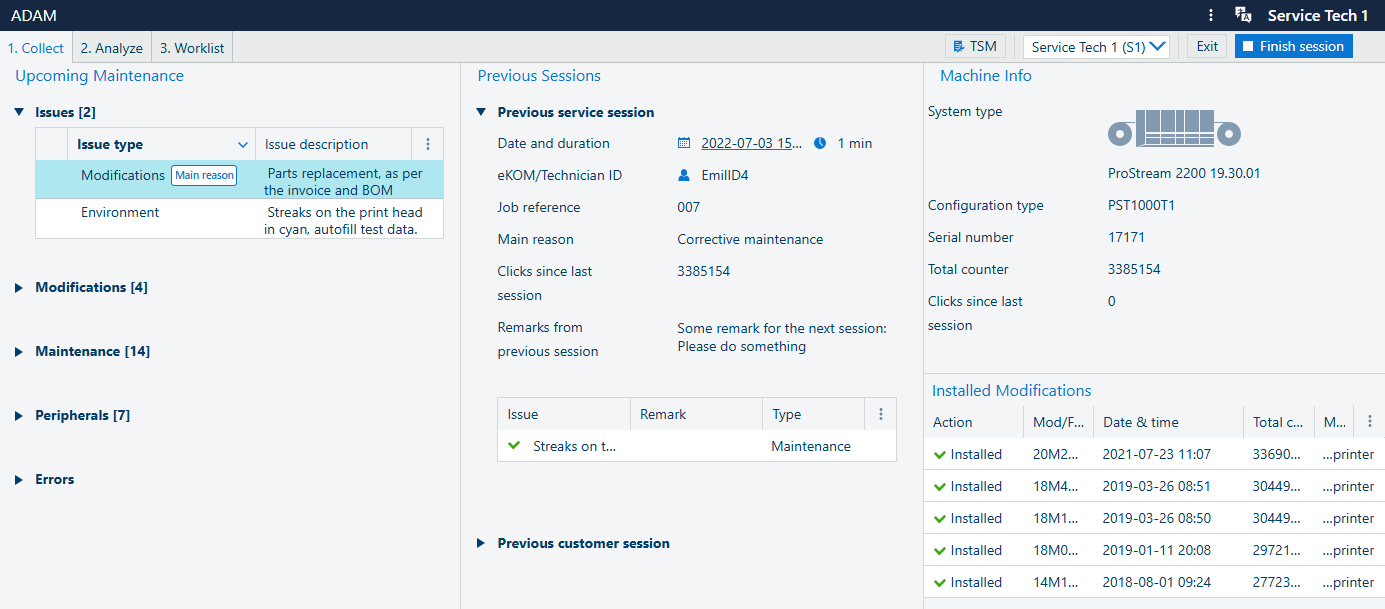
In the [Collect] screen you see all collected machine info, and you can start a new visit or finish the current one. Various relevant information from the previous visit is available in this screen.
This section offers a summary of the items that need to be addressed during the visit.
All the tables in this view can be sorted or filtered.
The dashboard is split into three columns:
[Upcoming Maintenance], describing the current state of the items needing attention
[Previous Sessions], describing the device's history
, with the details and [Installed Modifications], if existing
By default, the [Installed Modifications] table appears on the [Collect] page under the [Machine info] section. However, when the screen width drops below 1280 px, this section is moved to its own tab.
Each section has a number between square brackets, hinting about the number of relevant items.
Each category is initially collapsed, you need to click it to expand it. There is no limit on how many categories are expanded. Whenever a new category is expanded, all the ones below are shifted down.
This section provides an overview of the items that need to be addressed during the visit.
For more information, you can navigate directly from the [Collect] page to the [Worklist] page by clicking on the item you want to know more about.
All the tables in this view can be sorted, or filtered.
Expand the [Issues] section to view all the issues.
Click on one entry in the list of issues to go directly to the .
Expand the [Modifications] section to get information on the installed/removed modifications.
See: Modifications.
Click on one entry in the list of modifications to go directly to the .
Expand the [Maintenance] section to get information on the installed/removed modifications.
See: Modifications.
Click on one entry in the list of modifications to go directly to the .
See: Settings and counters.
Expand the [Peripherals] section to get information on the installed/removed modifications.
See: Modifications.
Click on one entry in the list of modifications to go directly to the .
Expand the [Errors] section to get information on the installed removed modifications.
See: Modifications.
Click on one entry in the list of modifications to go directly to the .
The panel [Previous Sessions] shows the last session done by a service representative, as well as the last one done by the customer:
|
Section |
Description |
|---|---|
|
[Previous service session] |
Previous session reasons/issues:
Remarks previous session: Two types of remarks exist, related to the previous session:
|
|
[Previous customer session] |
[Previous customer session]:
If there are no previous visits in ADAM, a message will appear letting you know that no data is available. |
The panel [Machine info] shows relevant details of the device.
This section of the screen shows the following information:
System type
Configuration type
Serial number
Total counter
Clicks since last session
The panel [Installed Modifications] shows the list with the installed modifications.
By default, the[Installed Modifications] table is displayed on the [Collect] page, right below the section. However, when the screen width is less than 1280 px, the [Installed Modifications] section is relocated to its own tab. All the rest of the sections are grouped together in a tab titled "Welcome".