
The [Timeline] view shows the usage of a device on a timeline. You can use this view to analyze device events over the last 30 days.
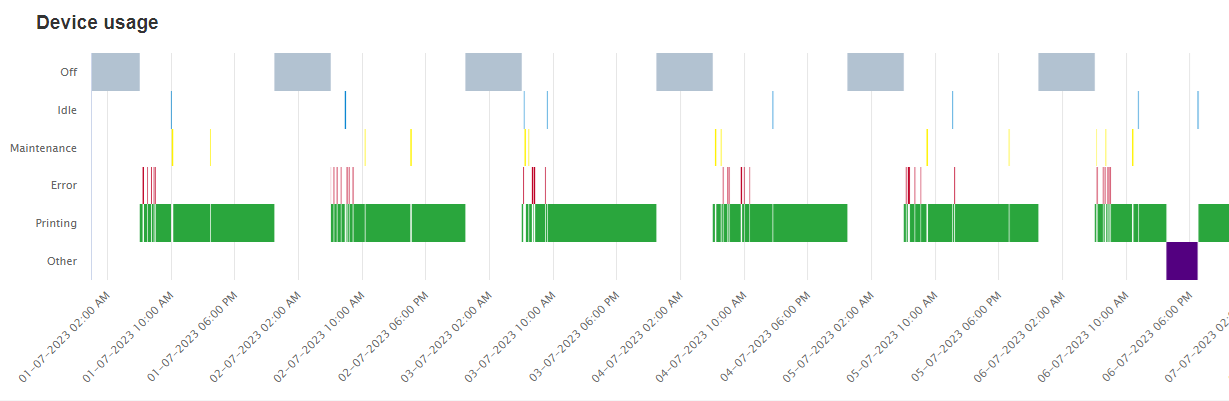 [Timeline] view
The following statuses are monitored and visible on the vertical axis.
[Off]
[Idle]
[Maintenance]
[Error]
[Printing]
The "Automatic maintenance" status for the varioPRINT iX-series is counted as "Printing".
[Other]
In case some data is missing or the printer is reset, the [Other] status is reported.
[Jobs]
You can now view the exact print jobs when the [Jobs] switch is toggled on, making it easy to see which job was running when an error occurred.
Job name, start and end time are displayed when the mouse cursor is hovered over the bottom part of the chart area.
Use this to pinpoint specific situations, as this switch loads a lot more data and will slow the user interface responsiveness.
The fields [Job name], [Start time] and [End time] are displayed when the mouse cursor hovers the chart.
This feature is not available for the continuos feed printing devices.
In order to use this feature, the printer has to be enabled in PRISMAlytics Accounting.
When you hover over the chart, you can see the status duration.
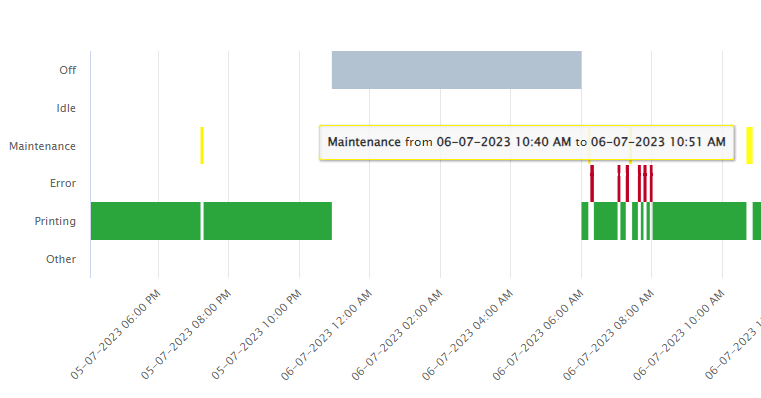 Status duration
It is possible to zoom in on the timeline graph. To zoom in on a specific time interval, click the starting time of the interval and drag to the end time. Zooming will scale the x-axis of the graph.
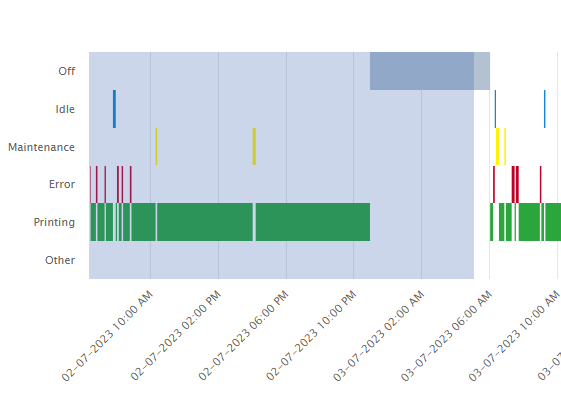 Selected interval
To reset the zoom, click the [Reset zoom] button.
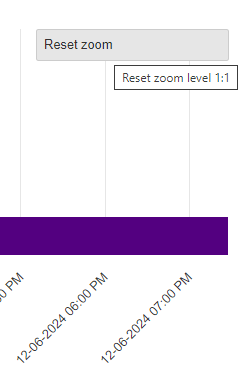 [Reset zoom] button