
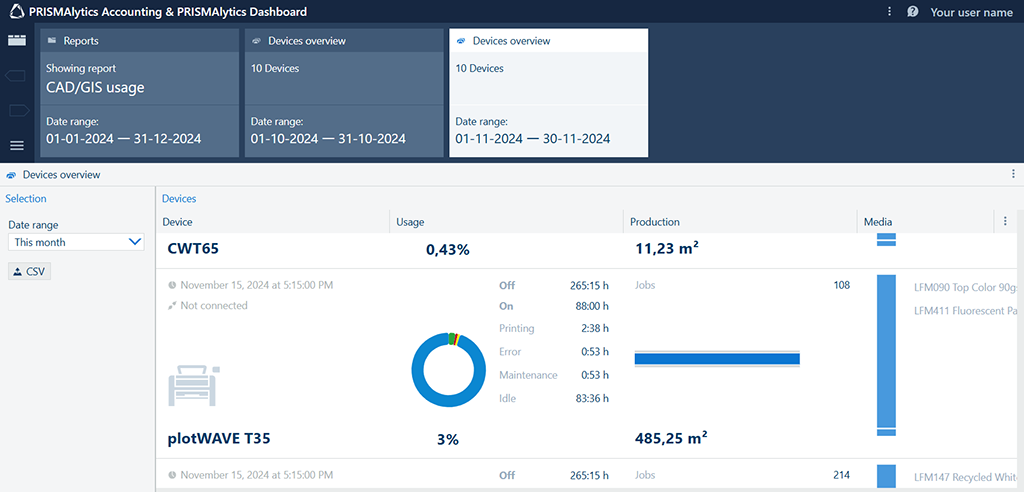
The [Devices overview] app shows all of your devices and their usage, productivity and consumable consumption. You can use this app to compare the performance of devices: today or during a certain period.
 [Devices overview] app
The [Devices] column shows the list of your printers with their name, image and connection status.
If the image of the device is dark gray, it means that the device is connected. When you hover over the device, the date and time of the last update is displayed.
If the image of the device is gray, the device is not connected. The date and time of the last update is always displayed.
The image of the device can also be gray if a device has successfully been registered but has not transmitted any data yet. In this case, a [No data] status is shown.
 Connected device
 |
 Disconnected device
 |
 Device with no data
 |
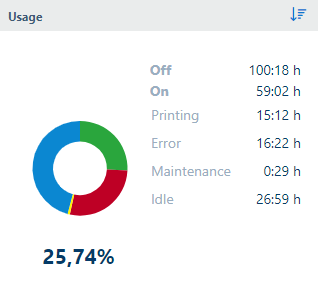
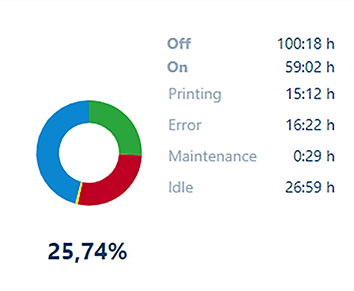
The [Usage] column shows the usage of the device during the selected period. You can see how long the device was on, off, idle, printing, in error, and undergoing maintenance. The percentage under the pie chart indicates the relative time the device was printing measured against the time the device was on.
 Device usage
The ring of the pie chart shows the time the device was on. The opening in the middle of the pie chart represents the percentage of time that the device was off. A wider opening means that the device was off longer.
 Device is off for a longer period of time
 |
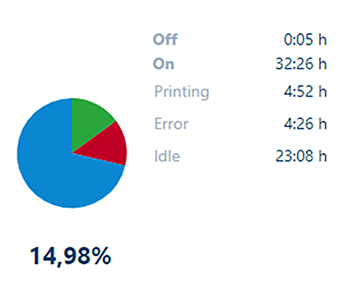 Device is off for a shorter period of time
 |
When you hover over the pie chart, you see the absolute time (hours:minutes), as well as the relative time (in percentages) measured against the time the device was on during the selected period, of the following statuses:
[Off]
[On]
[Printing]
[Error]
[Maintenance]
[Idle]
If you examine the device usage for a specific day, the duration of all devices statuses is not always equal to 24 hours. This happens if the device status cannot be interpreted by PRISMAlytics (known as [Other] status) and, therefore, is not displayed. However, this status can be seen in the [Timeline] view.
To learn more about the mapping between the existing device statuses and statuses that you see in PRISMAlytics, refer to Printer statuses.
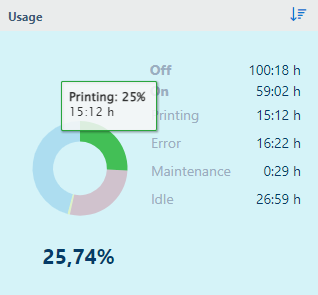 Time the device was printing
You can also hover over one of the statuses, and the corresponding part in the pie chart will be highlighted.
If you hover over [On] and [Off] statuses, the corresponding part in the pie chart is not highlighted.
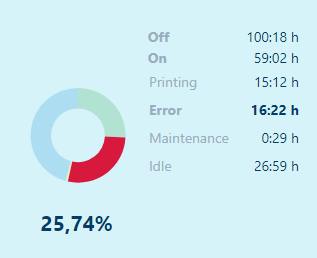 Error status highlighted
The [Production] column shows the productivity of the device during the selected period.
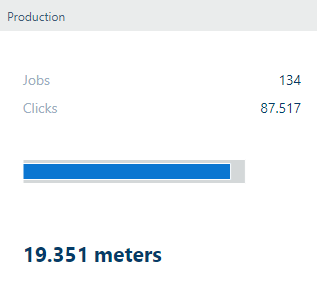 Print production
The [Production] graph shows the actual print production (blue) compared to the daily average over the past 28 days multiplied by the number of days of the selected period (grey).
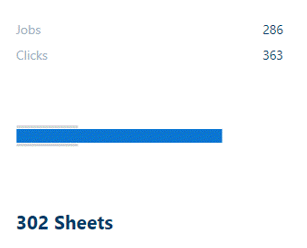 More production during the selected interval than average
 |
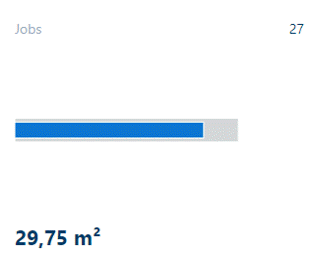 Less production during the selected interval than average
 |
The number below the graph indicates how many meters (feet), m² (ft²), or sheets have been printed during the selected period.
The number of [Jobs] includes all print jobs, including both production jobs and jobs that were not initiated by a user, such as maintenance jobs. A job with multiple copies counts as one job.
The number of [Clicks] reflects the total clicks counter of the device during the selected period.
The information about the number of clicks is not available for imagePROGRAF, plotWAVE and ColorWAVE ink printers (such as ColorWave 810/910/9000).
For cutsheet printers, printing on A3 is counted as 2 clicks while printing on A4 is counted as one click. For continuous feed printers, one click is equal to 1 foot (30.48 cm or 12 inch) printed simplex.
For varioPRINT iX-series and continuous feed printers, only the clicks for production jobs are counted.
Printers provide the number of clicks every 15 minutes. To view the correct number of clicks when you select [Today] as the date range, do not turn off the device within 15 minutes after the last job is printed.
When printing just before or during a date boundary, the correctness of the number of clicks provided at a specific day cannot be guaranteed.
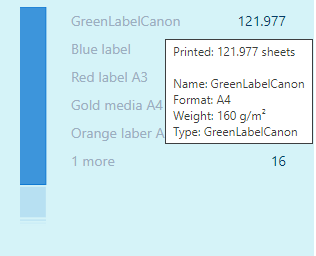
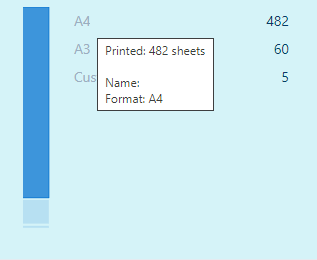
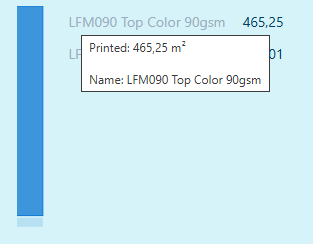
The [Media] column shows the information about the media you used during the selected period. You can view the names of the most used media as well as how much of these media was used.
If the media name is unknown, the media format is shown.
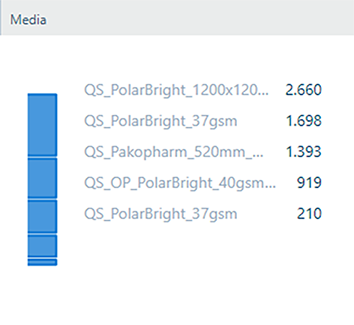 Most used media
Hover over the graph to see how much of a specific media was printed and what the proportion of this media was in regard to the other used media.
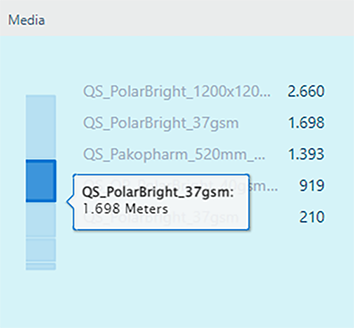 Printed meters
Hover over the media name to see more information about the media properties. Media properties shown here differ per device.
|
Continuous feed devices |

|
|
PRISMAsync cutsheet devices |
|
|
Non-PRISMAsync cutsheet devices |
|
|
imagePROGRAF devices |

|
|
ColorWave & PlotWave printers |
|
The [Consumables] column shows the consumption of consumables for the device during the selected period.
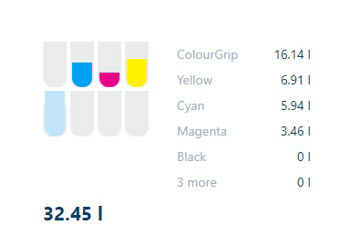 Consumables
The ink usage is shown in liters, toner usage is shown in grams (pounds), but for colorWAVE printers with toner it is displayed in kg. The total consumable usage is shown in bold.
The ink consumption represents the amount of ink that is pumped from the ink containers into the buffer tanks. The buffer tank functions as a reserve when the ink container is empty. This means that the ink container can be replaced during a print operation. The replenishment of the buffer tanks is therefore not in sync with the ink usage during printing. Refilling of the buffer tank results in spikes in [Consumables].
The consumable usage for continuous feed printers also includes non-production jobs, such as printhead purges and refresh pages.
The system jobs (Nozzle Uniformity Control (NUC)/ Nozzle Activity Control (NAC), purges and refresh dots/lines) for the varioPRINT iX-series are not included in the clicks counters by the PRISMAsync controller.
The graphs visualize the usage of each consumable. The size of the graph (gray part) is determined by daily average over the past 28 days multiplied by the number of days of the selected period. The colored part of the graph is determined by the actual amount of consumable used in the selected period.
If no information about consumables can be received from a device, a warning message is displayed.
 No consumable information available