
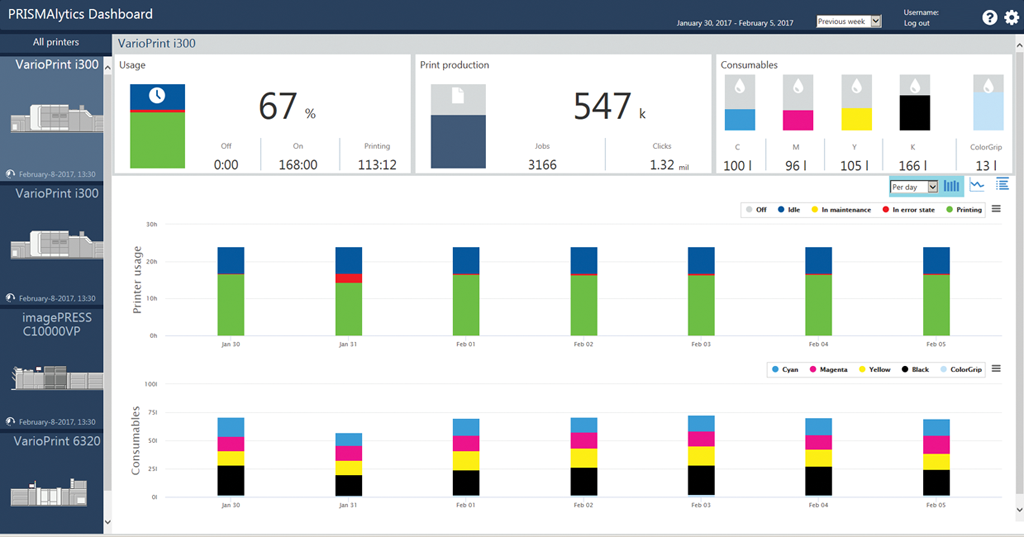
The PRISMAlytics Dashboard [Trends] view shows the usage and consumable consumption of a printer in block diagrams.
Use the [Trends] overview to do the following.
Analyze the printer usage and consumable consumption of a printer after you introduced improvements.
Analyze a non-productive printer over time.
Export historical information of a printer and store the .csv file for a further offline analysis.
Select a printer.
Select the [Trends] view

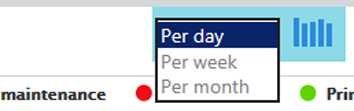
Select if you want to show diagrams per day, per week, or per month.
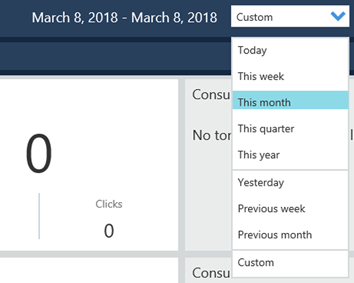
Select the period for which you want to see figures, for example previous week.
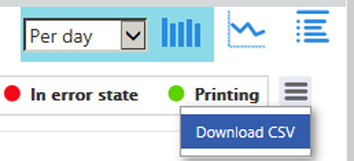
If required, export the displayed information.
All states the printer have been entered during the specified period are included in the [Printer usage] view.
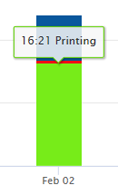
The [Printer usage] area shows the usage of the printer during the selected period. There is one block diagram per day, per week, or per month. A day starts at midnight.
When you hover over a diagram you see the absolute times (hh:mm) of states that occurred during the day, the week, or the month. The following states are monitored.
[Off]
[Printing]
[In error state]
[In maintenance]
[Idle]
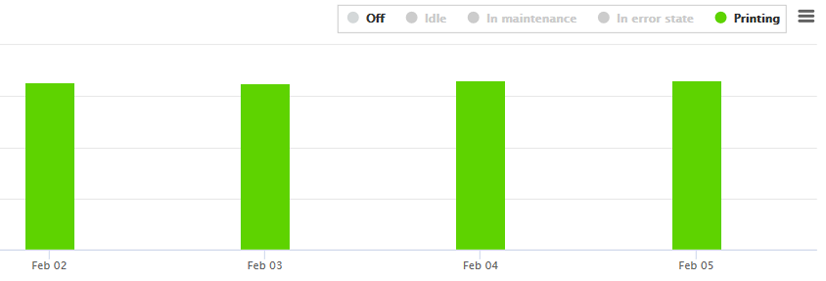
When you are only interested in specific states, click the states you want to include or exclude in the diagrams.
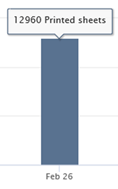
The [Printed sheets] area shows the number of printed sheets during the selected period.
When you hover a diagram you see the total number of printed sheets during the selected period.
The number of printed sheets is kept up-to-date. This allows you to keep track of the number of printed sheets when printing a large job or during transaction printing.
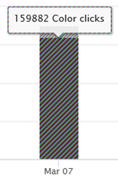
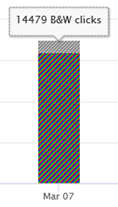
The [B&W and color] area shows a visual representation of the ratio between the number of black and white clicks and color clicks during the selected period.
When you hover the lower part of a diagram you see how many of the total clicks are color clicks. When you hover the upper part of a diagram you see how many of the total clicks are black and white clicks.
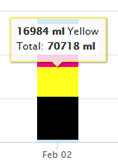
The [Consumables] area shows the consumable consumption of the printer during the selected period. There is one block diagram per day, per week, or per month. A day starts at midnight.
When you hover over a diagram you see the usage of each consumable and the total amount, per day, per week or per month.
When you are only interested in specific consumables, click the consumables you want to include or exclude in the diagrams.
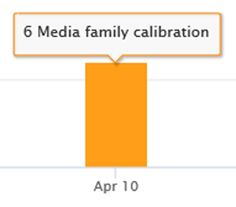
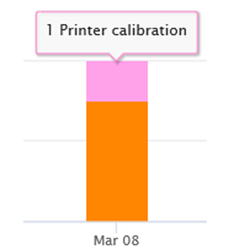
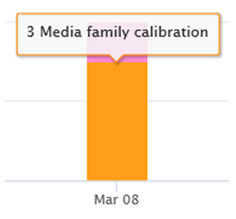
The [Calibration] area shows the number of calibrations during the selected period.
When you hover a diagram you see the number of calibrations.
|
VarioPrint i-series |
iPR C800 Series iPR C850 Series iPR C10000 series |
varioPRINT DP line VarioPrint 6000 line |
|---|---|---|
|
|
This printer requires no calibration. |