
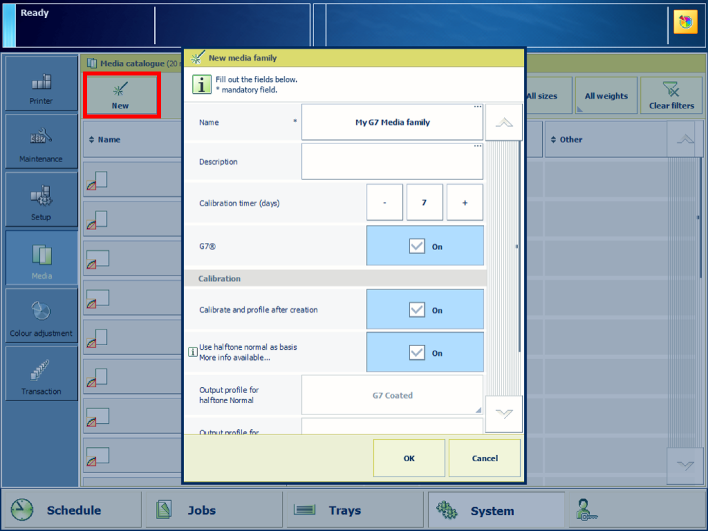
The calibration of a G7 media family calibration includes the very easy and quick creation of G7 output profiles with the PRISMAsync embedded profiler. PRISMAsync uses media families to indicate which output profiles and calibration curves must be applied to a media. Hence, the creation of a new media family with new output profiles and calibration curves are part of this procedure. PRISMAsync has regular media families and G7 media families.
 The G7 calibration options
For information about:
Colour based workflow, see Learn about the colour-based workflow.
Calibration, see Learn about calibration.
Tolerance levels, see View tolerance levels for colour evaluations.
Metrics, see Colour validation metrics.
Enable G7 see, Configure printer calibration.
You must always perform a printer calibration before you continue with this procedure.
After G7 media family calibration, the feedback window shows the results of the performed procedure
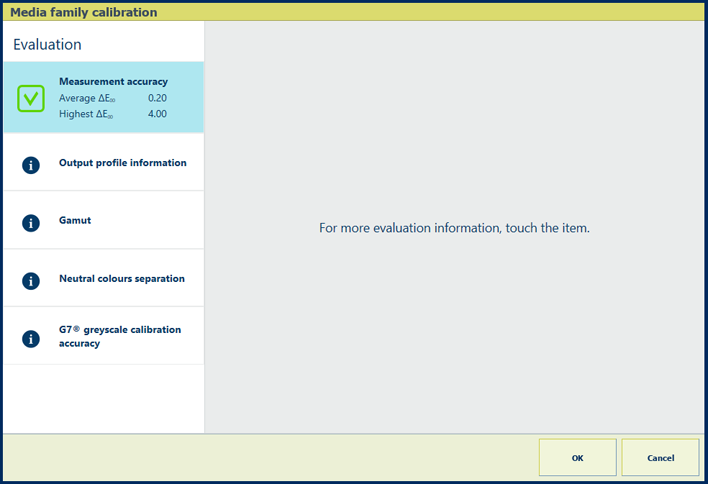 Feedback window of G7 media family calibration
When you see a green checkmark icon, touch [OK] to save the new calibration curves.
When you see a red cross icon, use the table below to evaluate the result. Then, touch [OK] to save the new calibration curves or [Cancel] to discard the results.
|
Feedback screen |
Remarks |
|---|---|
|
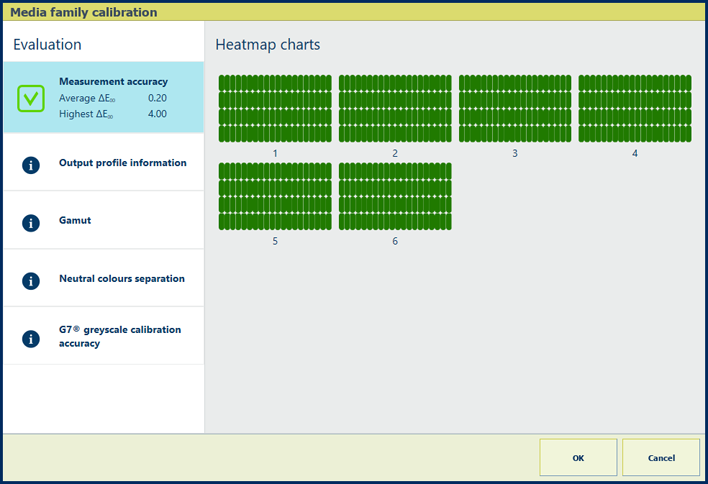
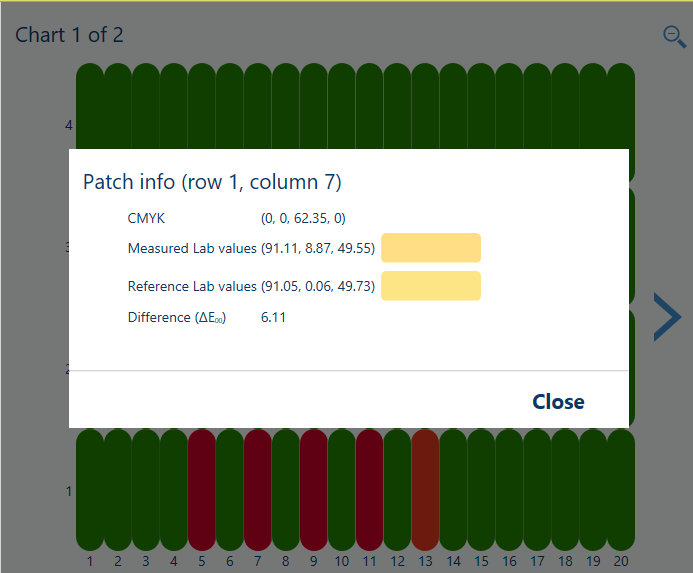
Description The ΔE values of the [Measurement accuracy] information are indicators for the accuracy by which the patches are printed and measured. The control panel displays a heatmap whose patch locations correspond with the printed chart. |
|
Evaluation
|
|
|
Options to improve colour quality
|
|
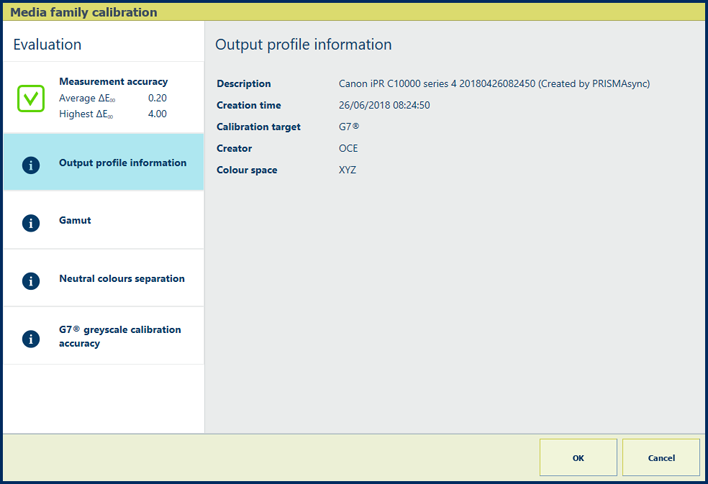
Description The [Output profile information] information shows the following characteristics about the output profile: description, creation time, calibration target, creator and colour space. |
|
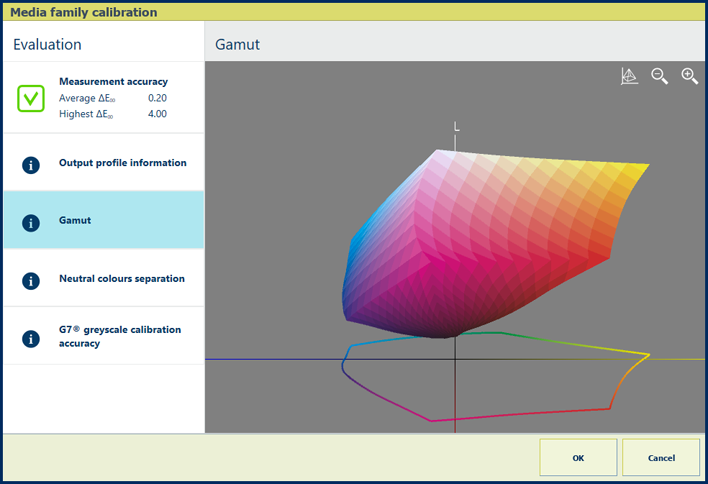
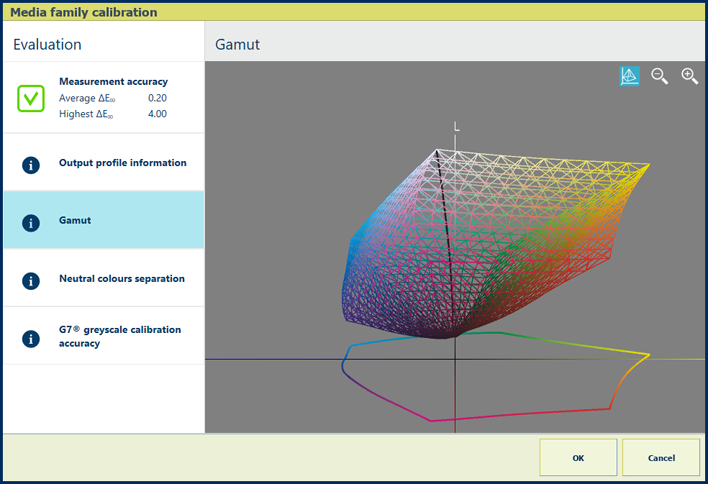
Description The [Gamut] information is an indication of the quality of the output profile. It is a visual representation of the colour gamut that the printer can produce with the created output profile on the used media. Touch the wire frame
|
|
Evaluation
|
|
|
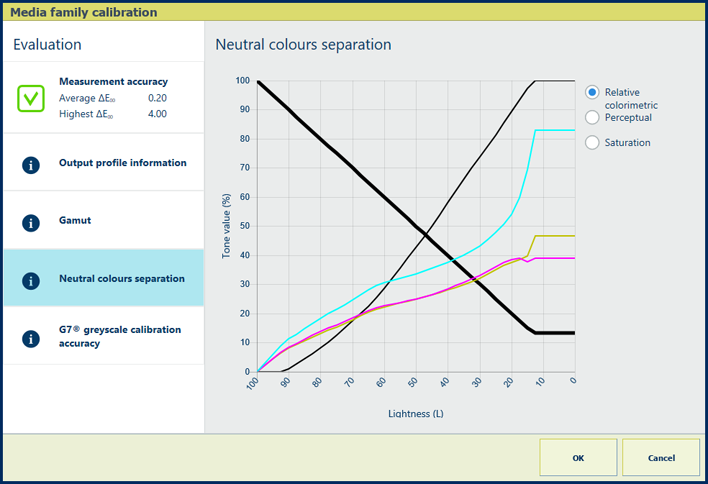
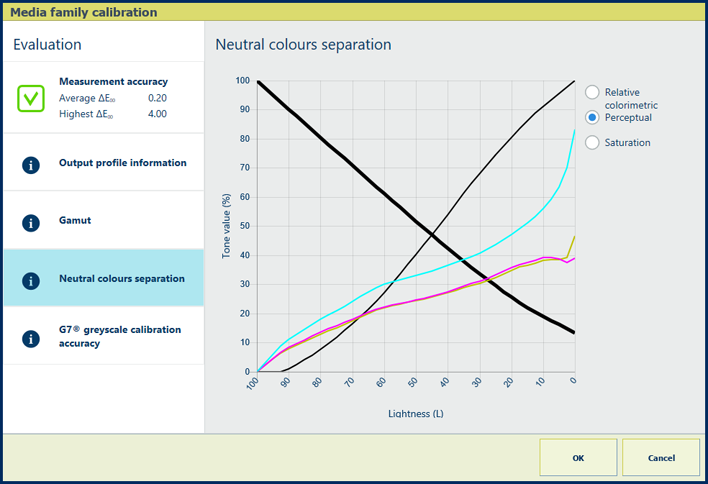
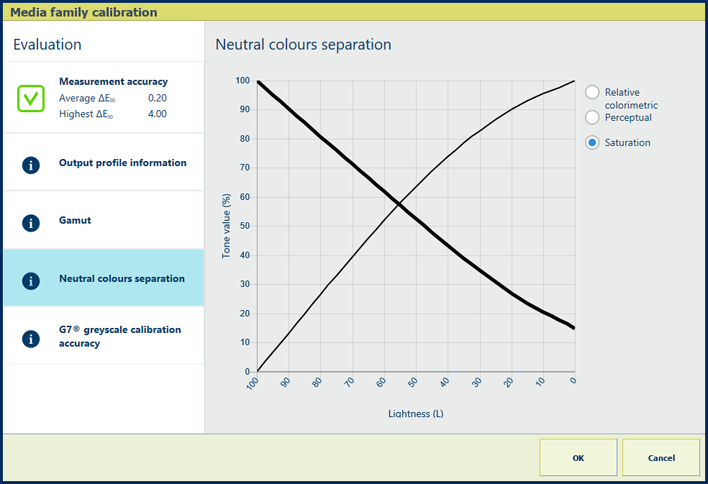
Description The thick black line of the [Neutral colours separation] graph shows how grey values are reproduced with the separate colours cyan, magenta, yellow and black (CMYK). Note that the darkest lightness value is on the left-hand side and the lightest value on the right-hand side. |
|
Explanation for [Relative colorimetric] selection The rendering intent [Relative colorimetric] reproduces true colours, for example for proofing applications and spot colours.
|
|
|
Explanation for [Perceptual] selection The rendering intent [Perceptual] reproduces contrasts in dark grey areas, for example for photos.
|
|
Explanation for [Saturation] selection The rendering intent [Saturation] reproduces saturated colours, for example for business graphics.
|
|
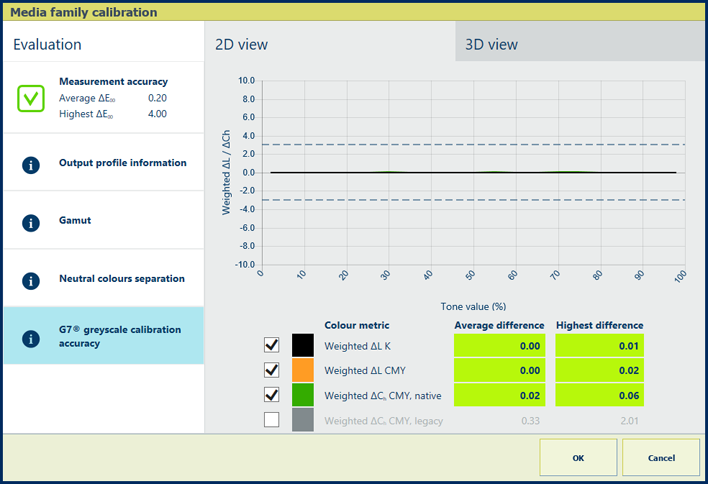
Description The percentage values of the information show how well the calibration procedure and output profile fit together. The graph shows per colour channel how close the measured values meet the G7 target values. |
|
Evaluation
You can perform the G7 verification procedure to verify if the printed output meets the G7 greyscale target. (Perform the G7 greyscale verification procedure) |
|
|
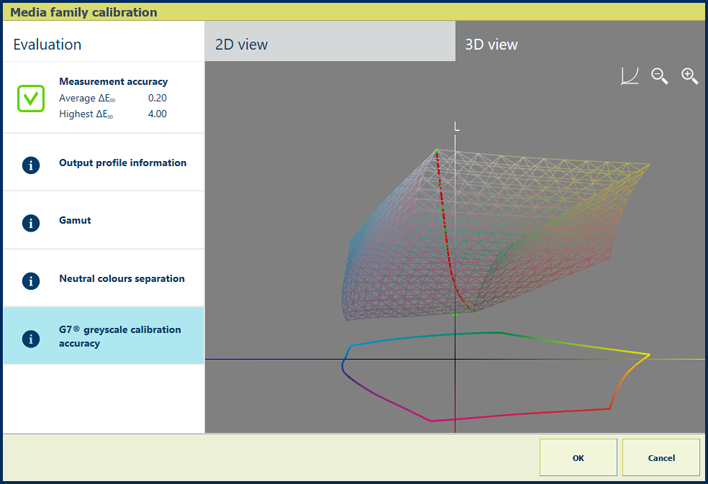
Description The information shows how well the calibration procedure and output profile fit together. The graph shows how close the measured greyscale curve (red) meets the G7 target greyscale curve (green). Touch the wire frame
|
 icon to view the black curve that shows the gradient of the neutral colours. This curve goes from paper white to the darkest colour black that the printer can produce.