
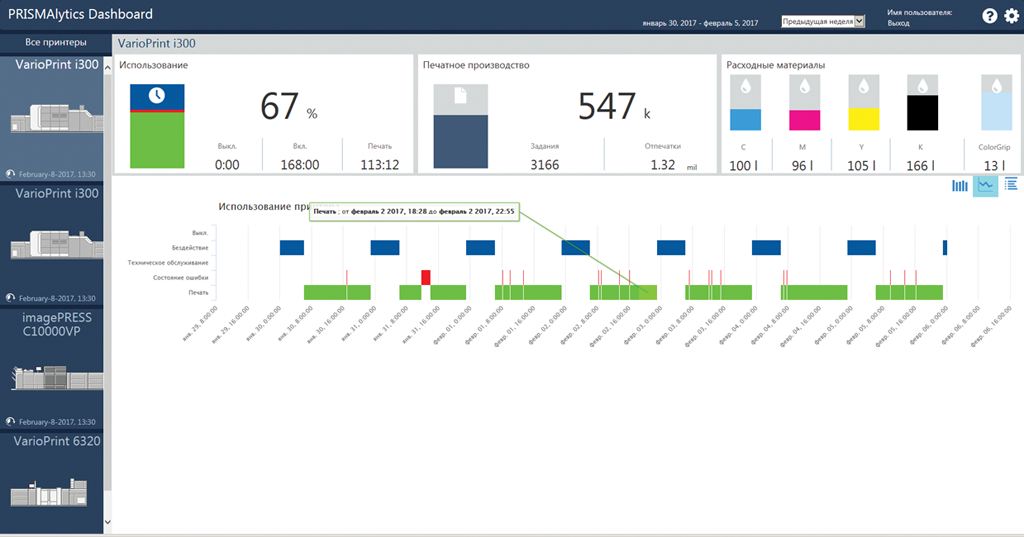
The Панель мониторинга PRISMAlytics [Временная шкала] view shows the usage of a printer on a timeline. You can use this view to analyse printer events of the last 30 days.
Select a printer.
Select the [Временная шкала] view.

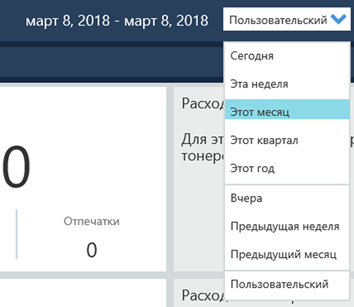
Select the period that reflects the information you want to display.
The [Временная шкала] view shows the states the printer has been entered during the specified period. When you hover the diagram, you see when the printer entered and left a state. The following states are monitored and visible on the vertical axis.
[Печать]
[Техническое обслуживание]
[Состояние ошибки]
[Бездействие]
[Выкл.]