
A graphical view of the top X recent errors (configurable based on the platform) is available. The graph encompasses data from the last 10 weeks and includes a zoom option for closer inspection.
If more than 7 visits were performed within 10 weeks, it is possible that no data is available for the whole 10 weeks. If this is the case, a generic "No data available" message is displayed.
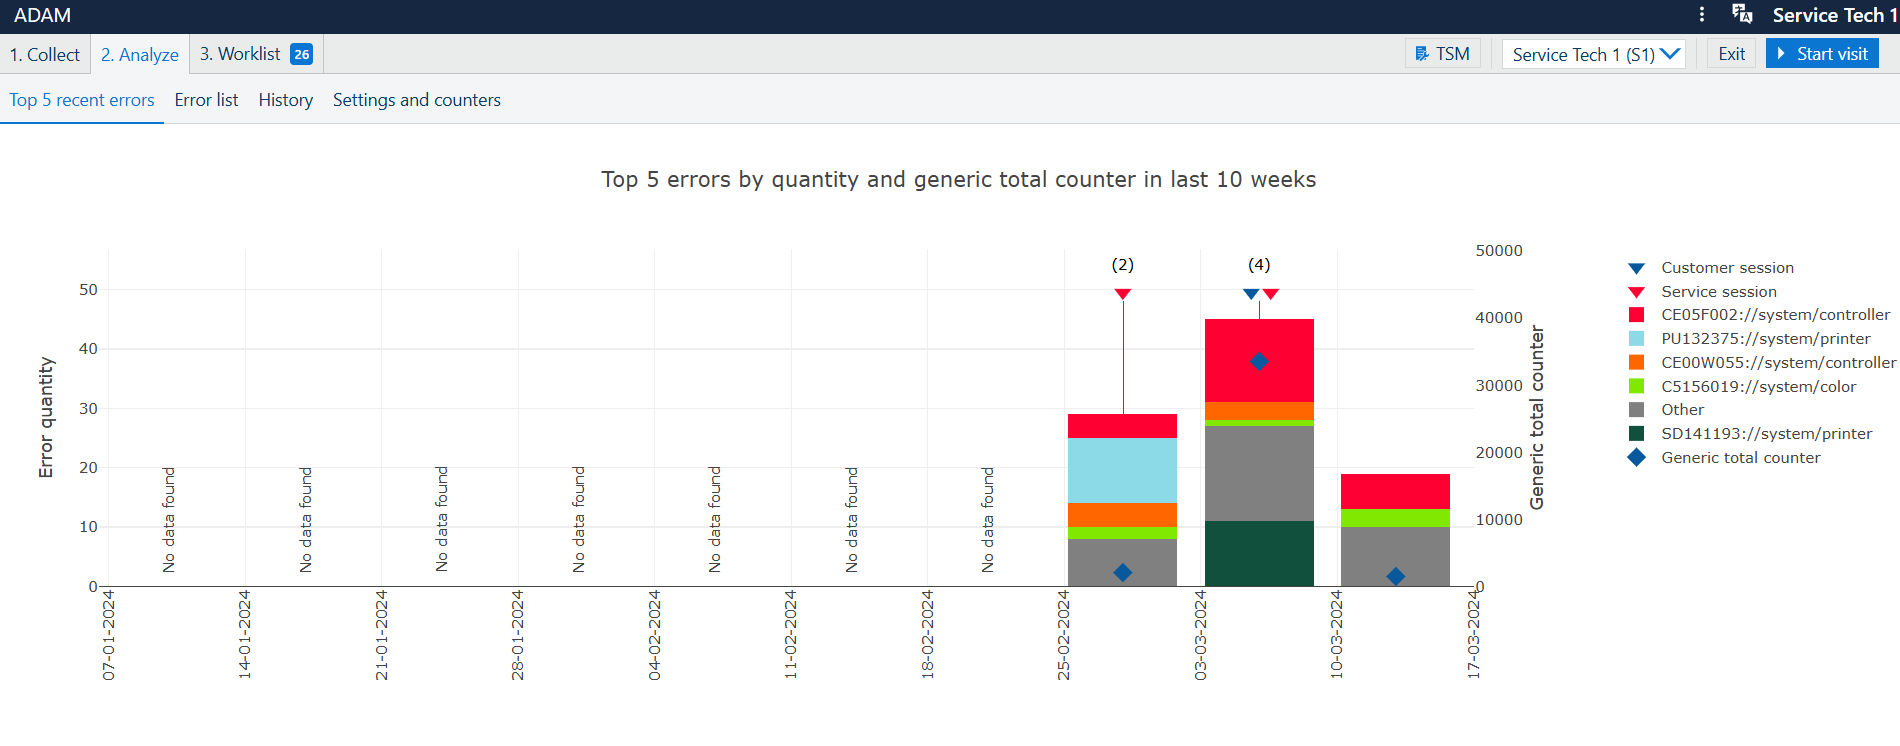
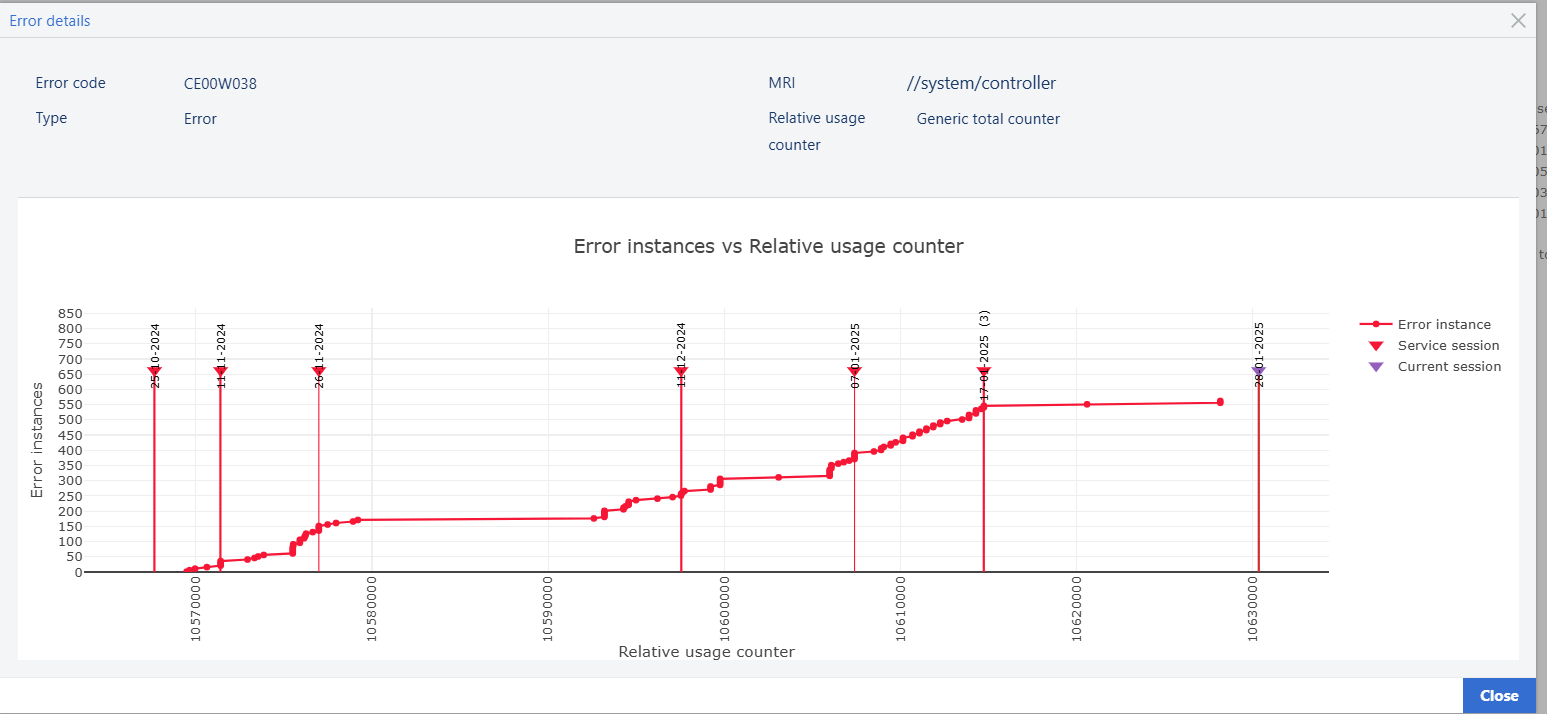
You can click one of the error descriptors in the legend to open a pop-up dialog the display with that specific error in isolation.
On this chart, clicking the legend information toggles the visibility of related markers on the chart.