
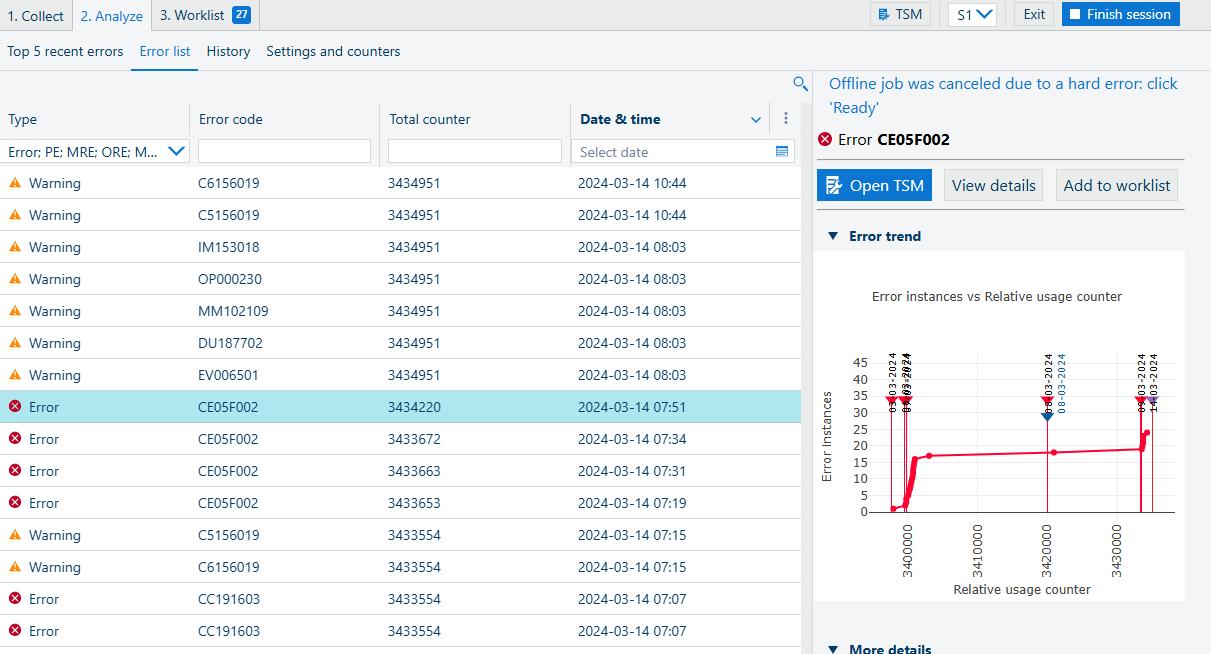
In the screen you find errors presented in different ways.
You can filter, sort, and customize the table by hiding or showing the columns, or changing the width of individual columns..
On top of the right-hand side panel with details, the toolbar offers a quick way of reaching the following functions:
[Add to worklist]
Opens the TSM document that explains this error/warning.
[More details]
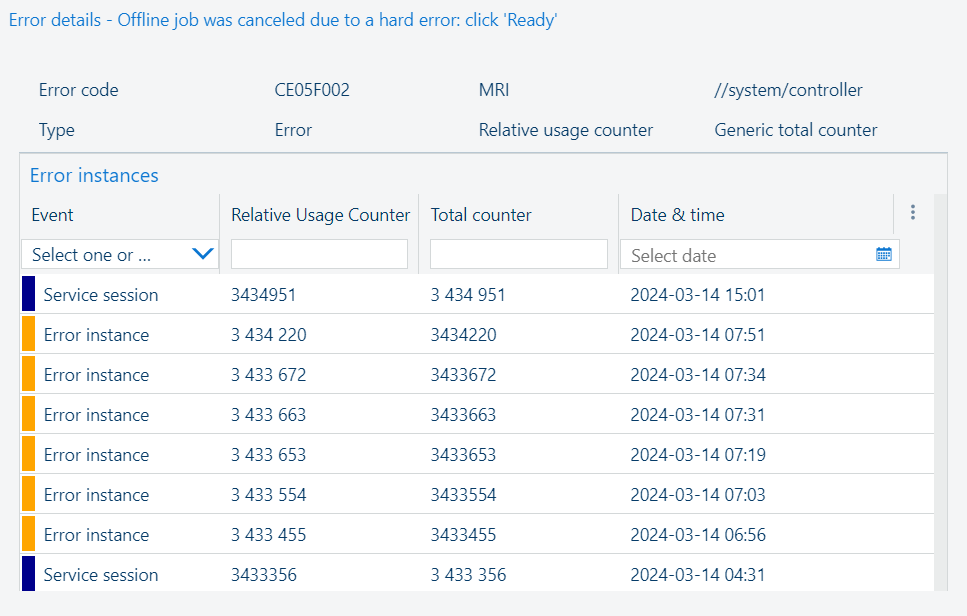
Opens a separate dialog showing details for the selected error.
Adds the selected error to the .
Click on the chart to open it in a new dialog.
Click the
![]() button to return to the main view.
button to return to the main view.
Click any of the items in the legend to toggle the visibility for that series in the chart.
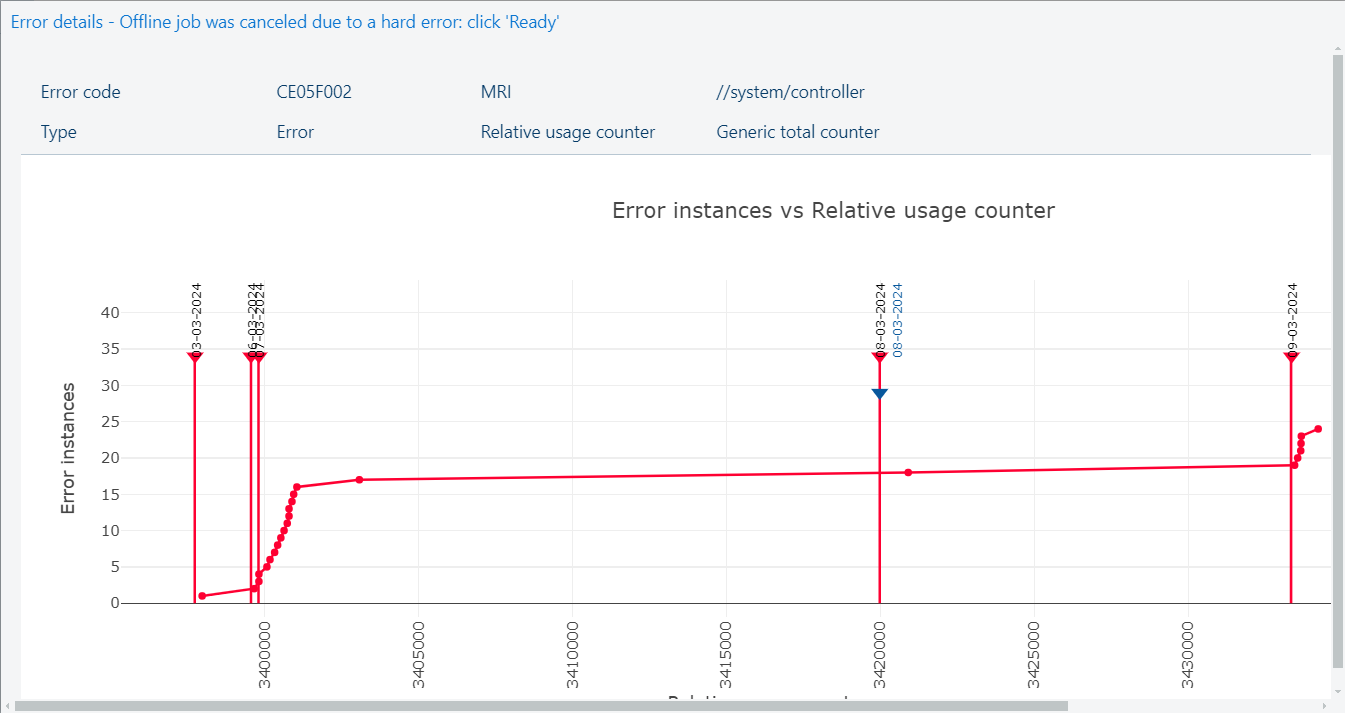
Click the [Close] button to return to the [Errors].
You can use the search bar at the top of the list to quickly find specific errors or warnings.
Use the filters below the column's header to select the types of information you want to display on the list. Click the header to sort the order of the items based on the data from that column.
Use the chart of the error/warning to get the details of the specific error/warning.
Use TSM at the end of the error/warning to open the TSM document that explains this error/warning.
Type
Type of error. Can be used in the filtering box to restrict the content of the list.
Can be one of:
MRE: Machine-Recoverable Error
ORE: Operator-Recoverable Error
PE: Permanent Error
MORPE
Warning
Start of session
End of session
Session opened
Session closed
Counter information
System info
Operating action
System state changed
Consumable replacement
Restore
Security
Error code
Description
MRI
Total counter
Date & time