
The [Trends] view shows the usage and consumable consumption of a printer in graphs.
Use the [Trends] overview to do the following:
analyze the printer usage and consumable consumption of a printer after you introduce improvements.
analyze a non-productive printer over time.
 [Trends] view
The way the data is displayed depends on the selected period and view. There are three available views: per day, per week, and per month.
It is only possible to select a view that is smaller or equal than the selected period. For example, if you select [Today] as the selected period, the view can only be set to [Per day].
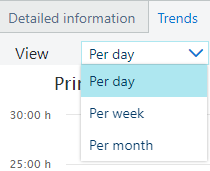 Available views
You can export the data of every graph in the [Trends] view as a CSV file. To export the data, click the [CSV] button.
The CSV file contains data per day, week or month (depending on the chosen view) for the selected interval. The data is raw, and the metric system of measurement is used.
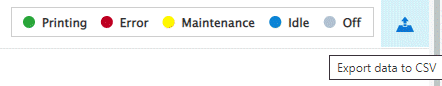 [Export data to CSV]
 By default, all data is displayed in the graphs. However, you can manipulate what is shown to you. To exclude the data from the graphs, click on the name of the item in the graph legend. To display the data again, click on the name.
For example, if you are only interested in the information about the usage of cyan and black inks in the [Consumables] graphs, click on the names of other inks to exclude their data from the graphs.
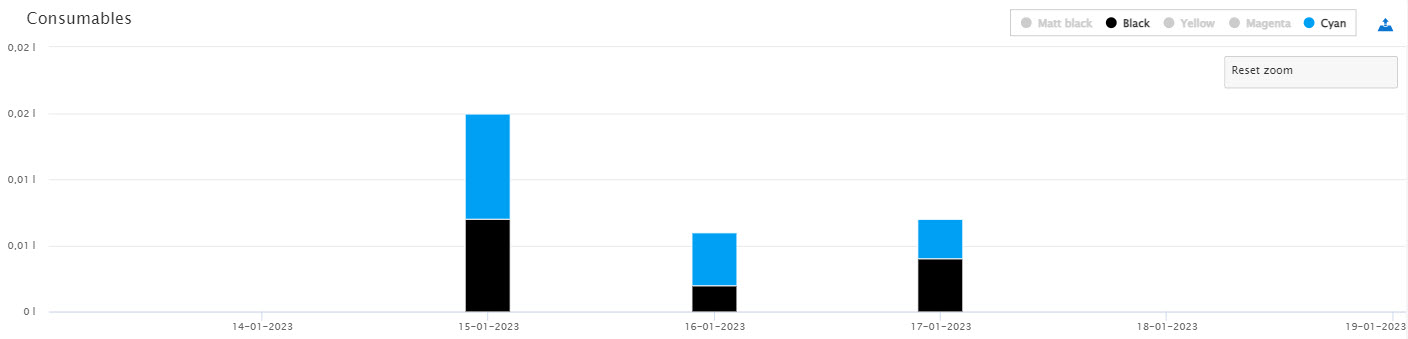 Only black and cyan displayed
Moreover, it is possible to zoom in on the trend graphs. To zoom in on a specific time interval, click the starting time of the interval and drag to the end time. Zooming will scale the axes of the graph.
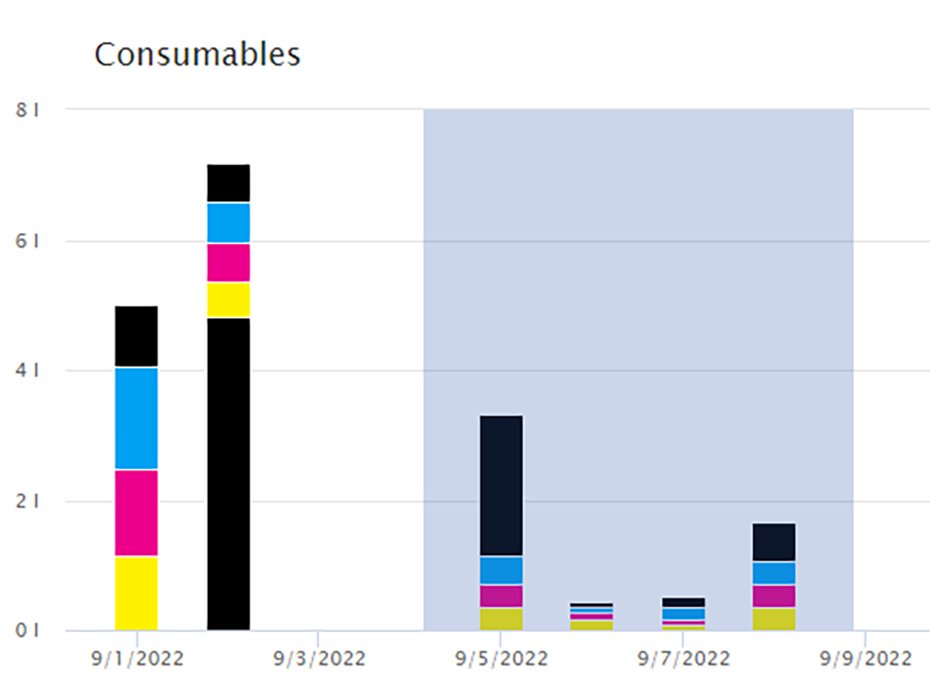 Selected interval
To reset the zoom, click the [Reset zoom] button.
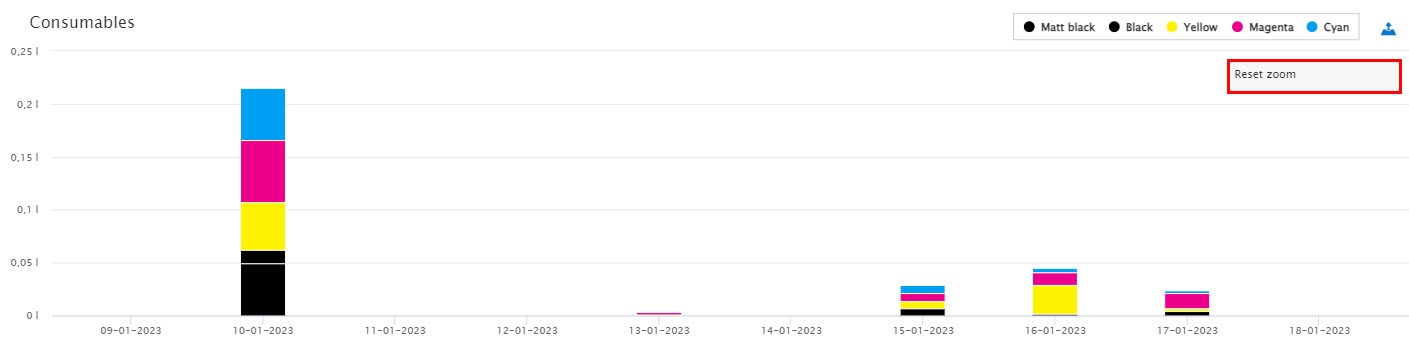 [Reset zoom] button
All printer statuses during the specified period are included in the [Printer usage] view.
The [Printer usage] graphs show the usage of the printer during the selected period. You see one graph per day, per week or per month. A day starts at midnight, a week starts on Monday.
It is only possible to select a view that is smaller or equal than the selected period. For example, if you select [Today] as the selected period, the view can only be set to [Per day].
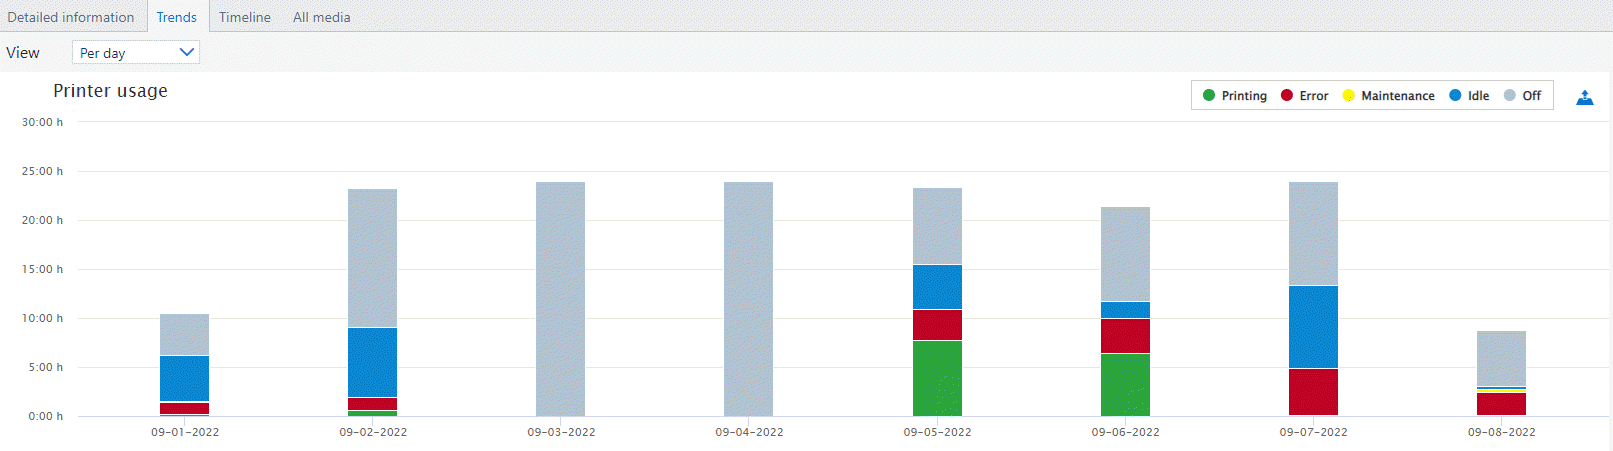
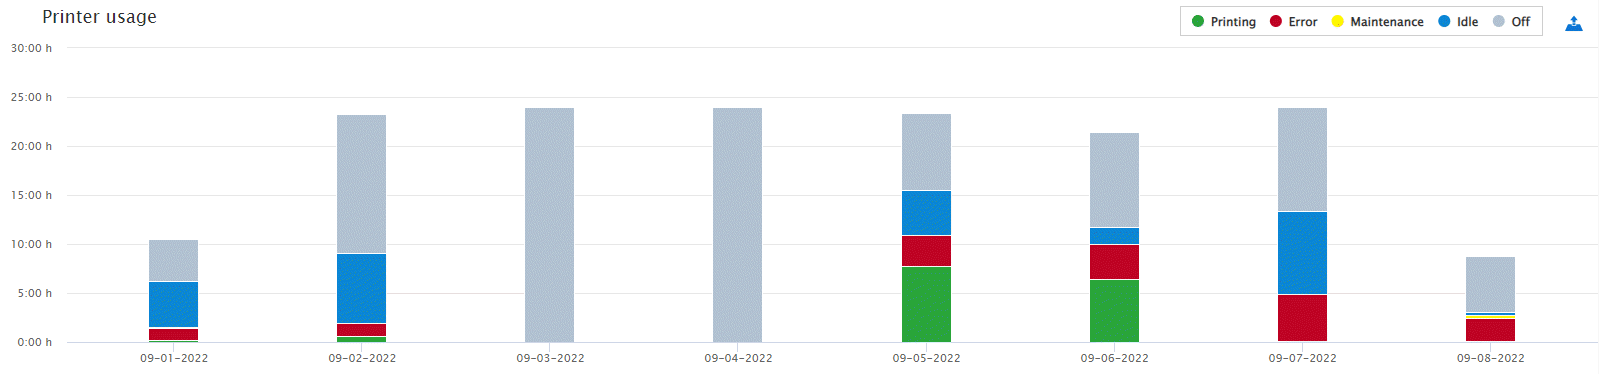 [Trends] view: [Printer usage]
 When you hover over a graph, you see the absolute times (hours:minutes) of printer statuses during the day, week, or month. The following statuses are monitored:
[Off];
[Idle];
[Maintenance];
[Error];
[Printing].
If you examine the printer usage for a specific day, the duration of all printer statuses is not always equal to 24 hours. This happens if the printer status cannot be interpreted by PRISMAlytics Dashboard (known as [Other] status) and, therefore, is not displayed. However, this status can be seen in the [Timeline] view.
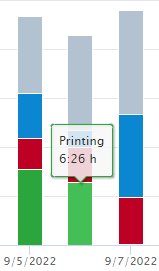 Printing status
The print volume graphs show the number of printed sheets, meters (feet), or square meters (square feet) per day, week, or month.
It is only possible to select a view that is smaller or equal than the selected period. For example, if you select [Today] as the selected period, the view can only be set to [Per day].
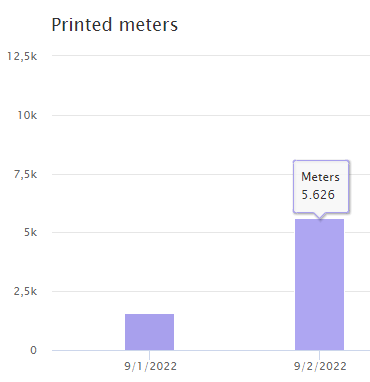
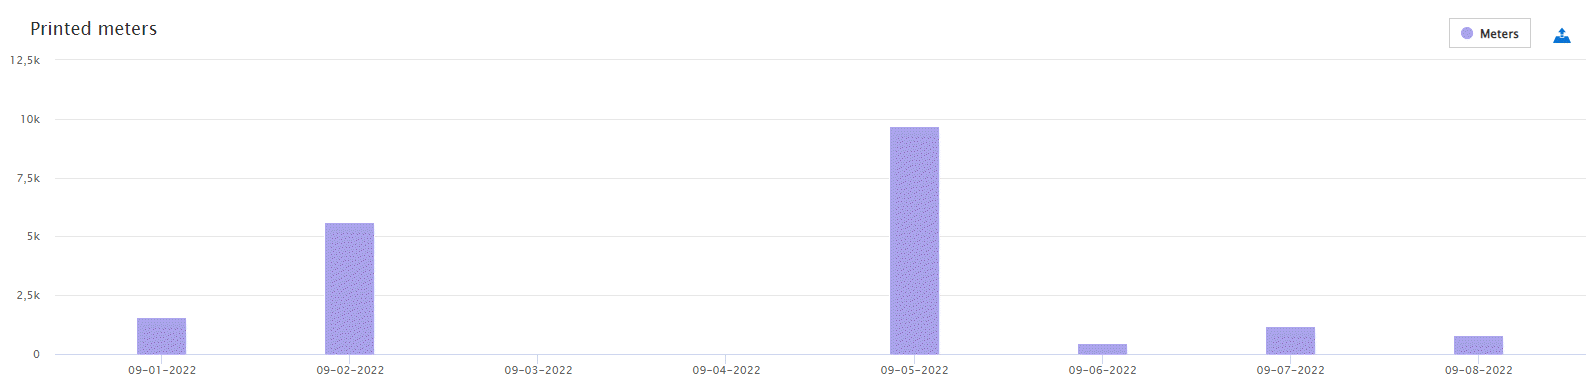 [Trends] view: [Printed meters]
 When you hover over a graph, you see the number of sheets, meters (feet), or square meters (square feet) printed that day, week, or month.
 Printed meters per day
The number of printed sheets, meters (feet), or square meters (square feet) is kept up-to-date. This allows you to keep track of the number of printed sheets, meters (feet), or square meters (square feet) when printing a large job or during transaction printing.
The information about the clicks is not available for imagePROGRAF printers.
The [Clicks] graphs show a visual representation of the ratio between the number of black & white clicks and color clicks.
When you hover over the lower part of the graph, you see how many of the total clicks are color clicks. When you hover the upper part of the graph, you see how many of the total clicks are black & white clicks.
For varioPRINT iX-series and continuous feed printers, only the clicks for production jobs are counted.
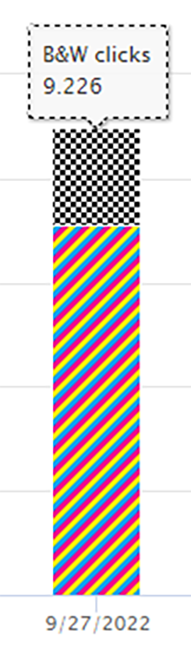
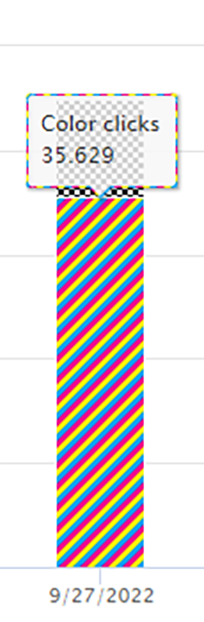 Clicks
The [Consumables] graphs show the consumable consumption of the printer during the selected period. You see one graph per day, per week, or per month. A day starts at midnight, a week starts on Monday.
It is only possible to select a view that is smaller or equal than the selected period. For example, if you select [Today] as the selected period, the view can only be set to [Per day].
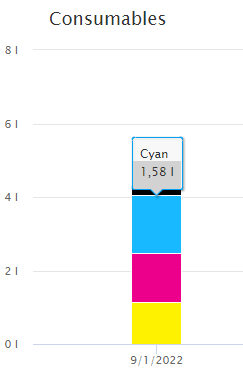
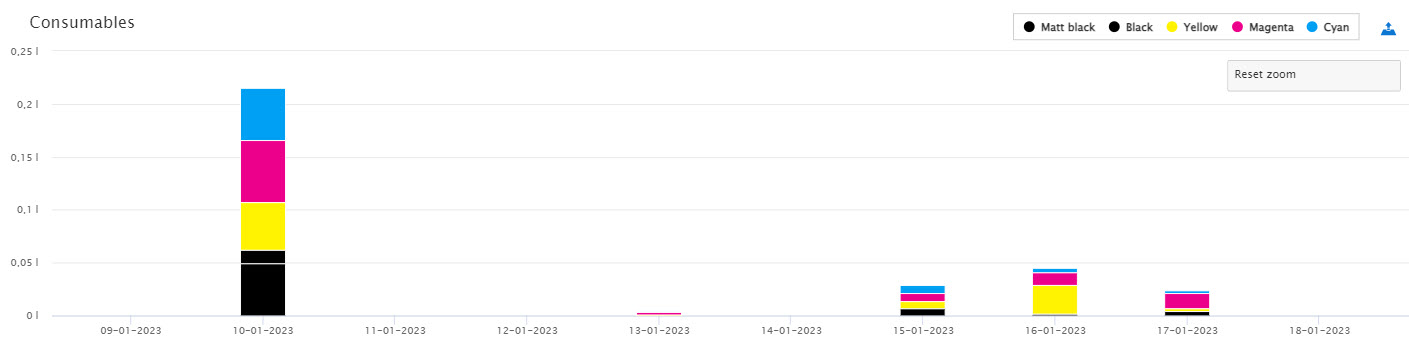 [Trends] view: [Consumables]
 When you hover a graph, you see the usage of each consumable per day, week or month.
The ink consumption represents the amount of ink that is pumped from the ink containers into the buffer tanks. The buffer tank functions as a reserve when the ink container is empty. This means that the ink container can be replaced during a print operation. The replenishment of the buffer tanks is therefore not in sync with the ink usage during printing. Refilling of the buffer tank results in spikes in [Consumables].
The consumable usage for continuous feed printers also includes non-production jobs, such as printhead purges and refresh pages.
The [Calibration] graphs shows the number and type (printer or media family) of calibrations during the selected period.
The information about printer calibrations is available for PRISMAsync and non-PRISMAsync cutsheet printers.
The information about media family calibrations is not available for non-PRISMAsync cutsheet printers.
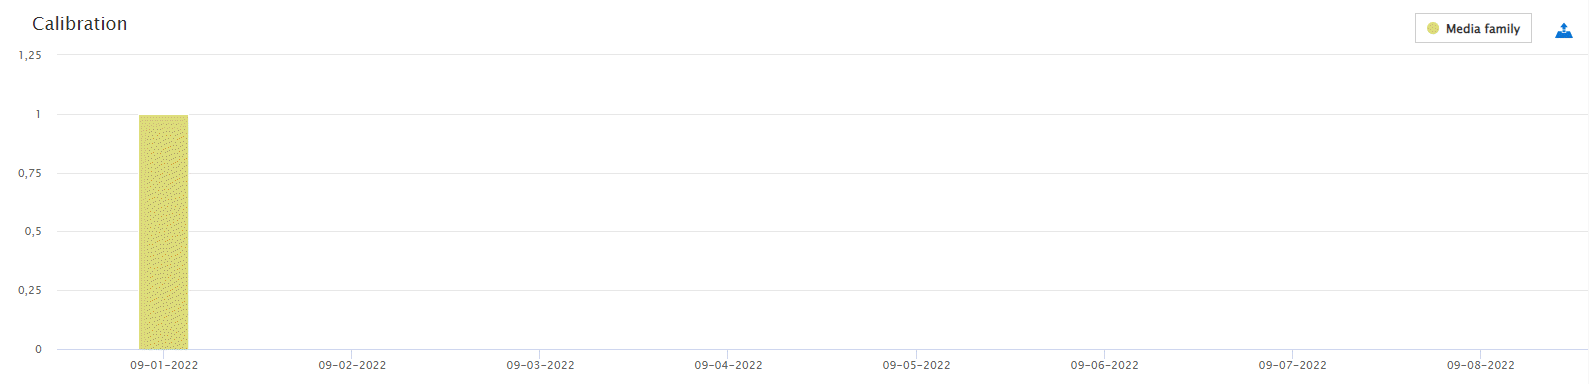 [Trends] view: [Calibration]
 When you hover a graph, you see the number and type of calibrations per day, week, or month.
It is only possible to select a view that is smaller or equal than the selected period. For example, if you select [Today] as the selected period, the view can only be set to [Per day].
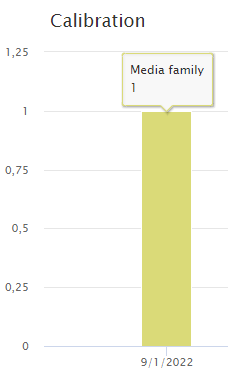 Media family calibration