
After you measured the charts, the feedback window shows the results of the performed procedure. Depending on a setting in the Settings Editor you see a basic feedback window or a detailed feedback window (default).
The basic feedback window shows whether the measurements were successfully completed or not.
The detailed feedback window shows the measurements in detail. This topic describes the information in the detailed feedback window.
Depending on the feedback information, you can decide to save the new calibration curves or discard the results.
The comparison with the previous calibration informs you how urgent this media family calibration was.
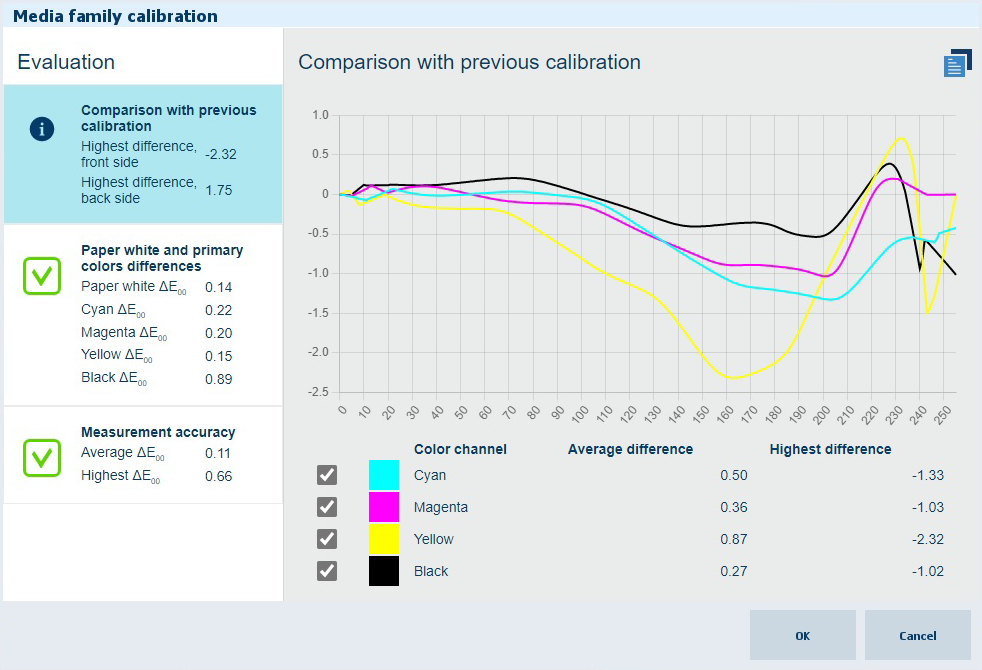
The summary area shows the highest and average differences between the two calibrations per color channel.
When you touch the summary area, you see lines that indicate how the curves of this and the previous calibration deviate. Horizontal lines mean that the curves are identical. When one or more curves show significant differences, the new media family calibration can be considered as necessary.
Touch the icon in the right-hand top corner to switch between the front side and back side:

For the first calibration of the media print mode there are no reference values and thus no feedback information.
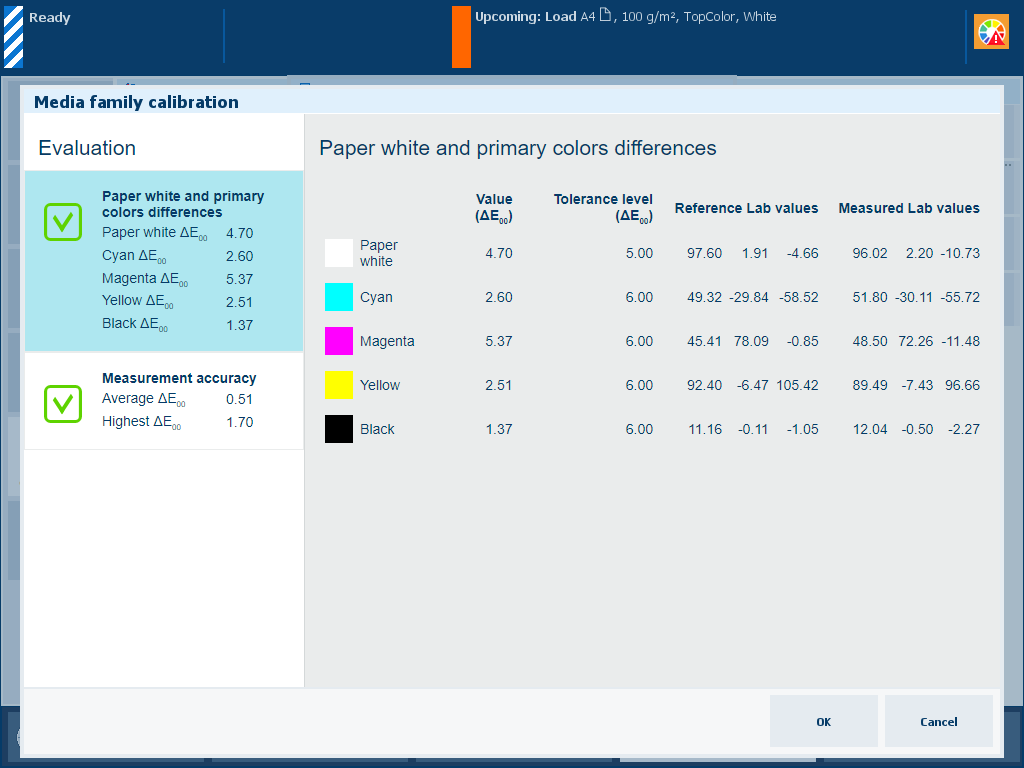
The feedback on the measured paper white and primary colors window shows how far the measurements deviate from the reference values. The reference values are taken during the first calibration of the media print mode. The reference values are re-calculated when the media print mode has a new output profile.
The summary and detailed views show the differences, the measured values, and the reference color values for both sides.
For the first calibration of the media print mode there are no reference values and thus no feedback information.
The measurement accuracy information indicates if the patches were measured accurately. Therefore, tolerance levels are used.
Charts must be measured correctly within certain speed limits. Although the calibration wizard shows what you must measure and when you must redo a measurement, it can still be possible that your measurements were not performed correctly.
The summary area shows the average and highest color differences between the measured and the reference values.
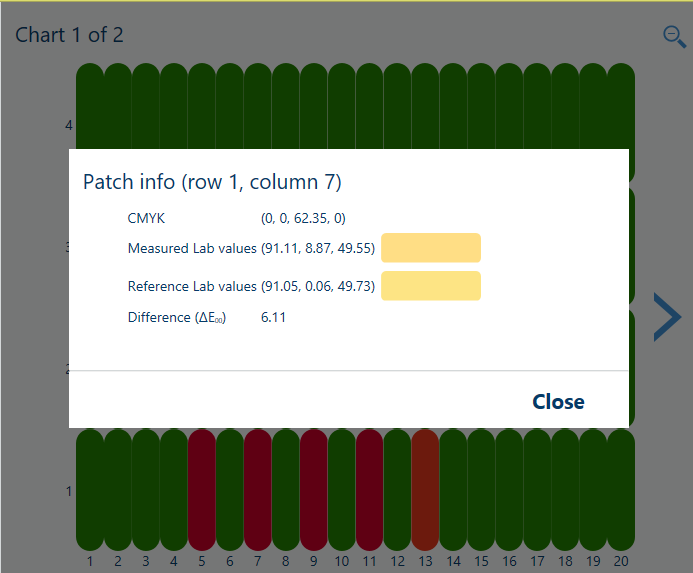
When you touch the summary area, you see more information. Every measured patch of both calibration charts are represented in the heatmap. The heatmap indicates how accurate the measurements of the patches were performed.
When the feedback shows that the measurements were not accurate enough according to the configured tolerance levels, perform the media family calibration again.
The heatmap patches are green, red, or have a gradient between green and red. In this way the color makes visible which patches are correctly, incorrectly or suspiciously measured. The tolerance levels set for the media family calibration determine when patches turn red and green.

Touch the summary information. The heatmap appears.
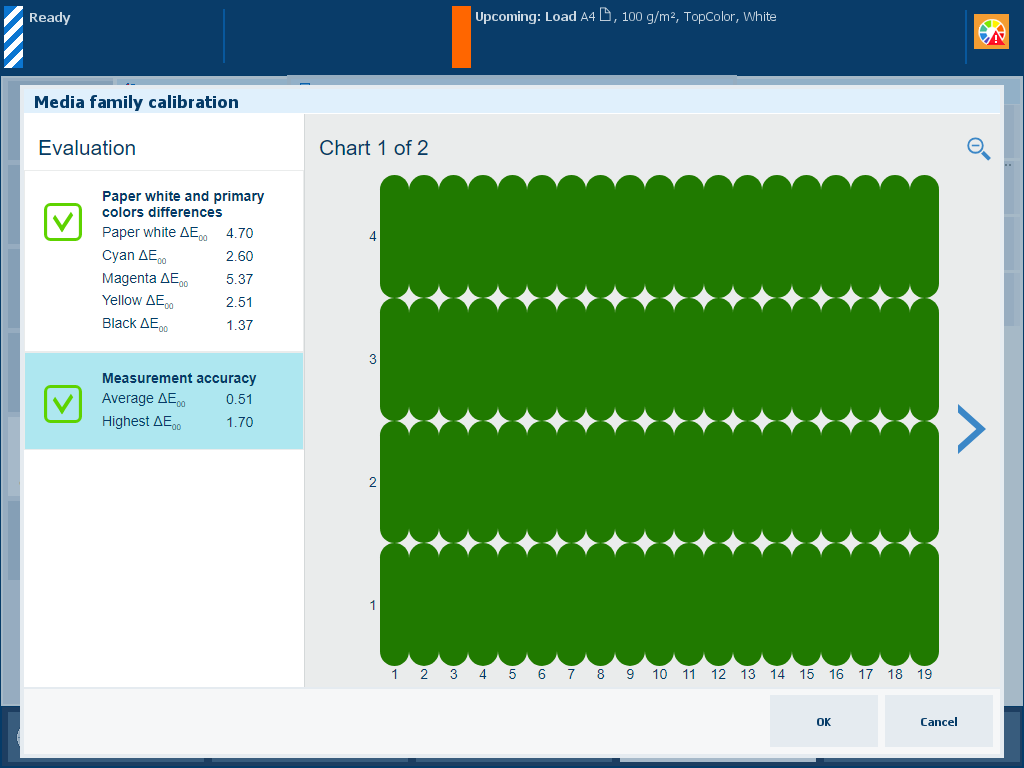
Touch the > and < symbols to scroll through the calibration charts. Use the zoom symbol to zoom in or out.
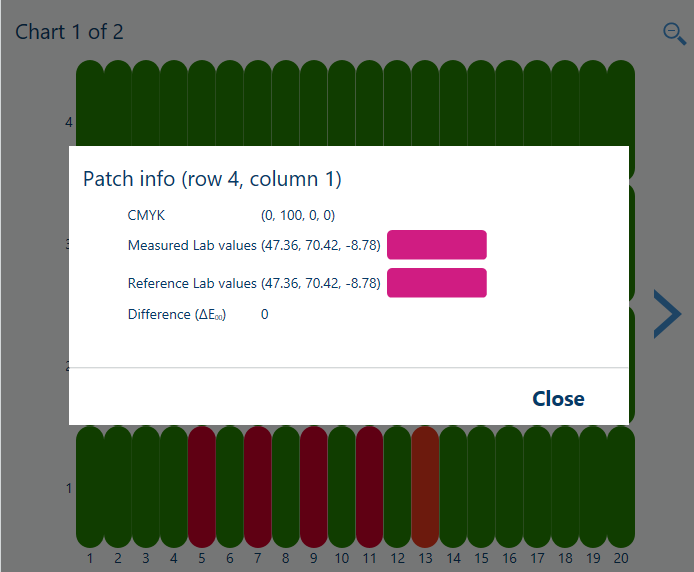
In this example, the heatmap shows green, orange, and red patches. The patch contains more details about the measured colors, the reference colors, and the color differences.
Use the zoom symbol to zoom into a detail of the heatmap.

When you touch a green heatmap patch the color difference falls within the set tolerance level.
 Meeting tolerance level
When you touch a red patch, the color difference (6.11) falls outside the set tolerance level (5).
 Exceeding tolerance level