
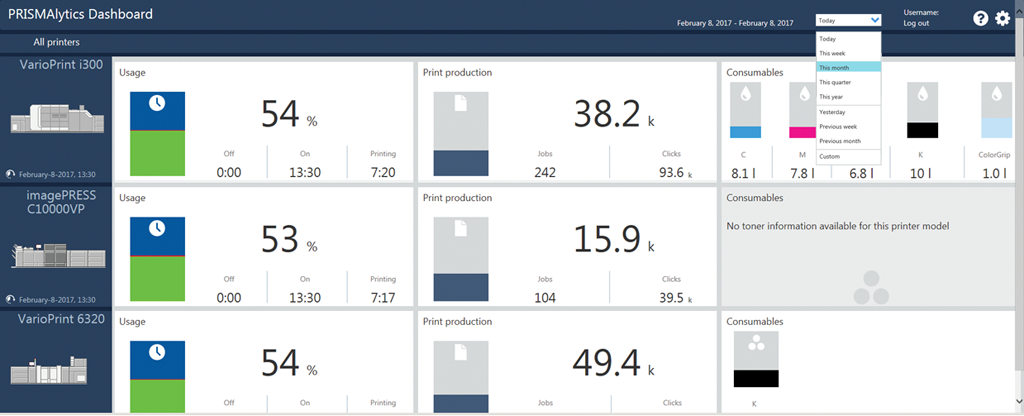
The PRISMAlytics Dashboard [All printers] view shows the printers and their usage, productivity, and consumable consumption.
Use the [All printers] overview to compare the performance of printers: today or during a certain period.
The usage, productivity, and consumable consumption information of a printer is also visible on the [Detailed information] view, the [Trends] view, and the [Timeline] view.
Click [All printers].
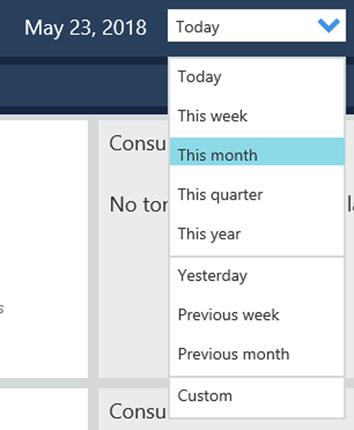
Select the period that reflects the information you want to display.
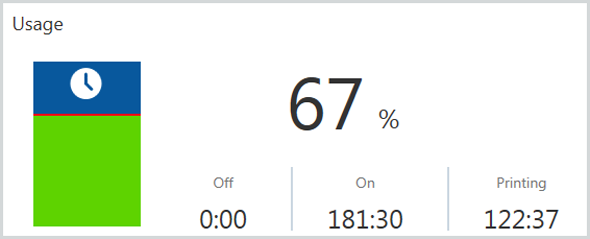
The [Usage] area of the printer shows the usage of the printer during the selected period. A day starts at midnight.
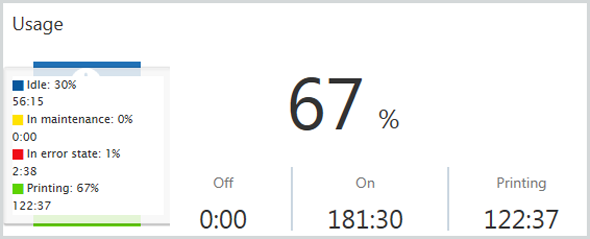
When you hover the diagram you see the absolute time (hh:mm) and the relative time (measured against the time the printer was on during the selected period) of the following states:
[Idle]
[In maintenance]
[In error state]
[Printing]
The Printing percentage is the relative time the printer was printing, measured against the time the printer was on during the selected period.
The [Off] value is the absolute time (hh:mm) the controller of the printer was shut down during the selected period.
The [On] value is the absolute time (hh:mm) the controller of the printer was on during the selected period.
The [Printing] value is the absolute time (hh:mm) the printer was printing jobs during the selected period.
The [Print production] area shows the productivity of the printer during the selected period.
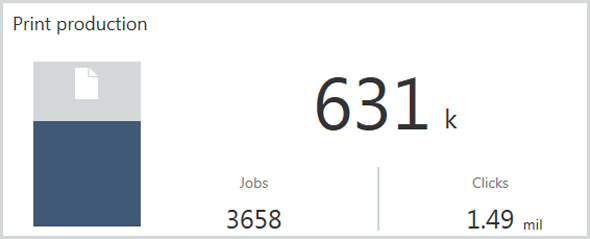
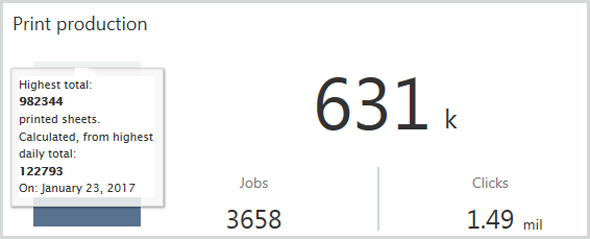
The [Print production] diagram shows the print production (blue) weighed against the highest production. When you hover the diagram you see how the highest production is measured.
When you selected [Today]: the diagram shows the highest measured daily amount of printed sheets and the corresponding date.
When you selected a period: the diagram shows the highest total amount of printed sheets. This value is calculated as follows: <highest measured daily amount of printed sheets> multiplied by <number of days of the period>.
The [Print production] amount reflects the number of sheets (per 1000) that have been produced during the selected period.
The number of jobs reflects all print jobs, including (configuration) reports, proofs, and tickets that have been produced during the selected period.
The number of clicks reflects the total clicks counter of the printer during the selected period.
When the printer is printing at 0.00, the clicks are counted per day. However, a fault tolerance of 100 sheets can occur since sheets are counted per 100.
The [Consumables] area shows the consumption of consumables during the selected period. The diagrams depend on the consumables the printer uses: toners, CMYK inks, ColorGrip, MICR.
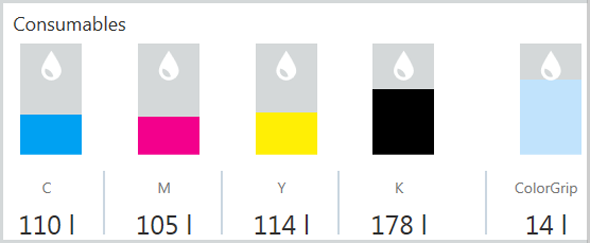
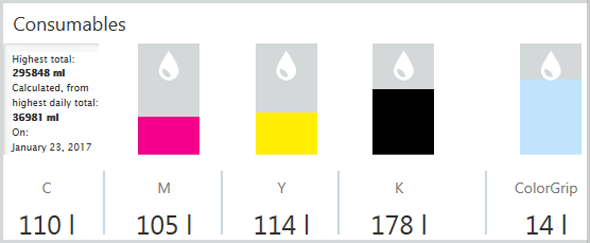
The [Consumables] diagram shows the consumable consumption (in the colour of the consumable) weighed against the highest consumption. When you hover the diagram you see how the highest consumption is measured.
When you selected [Today]: the diagram shows the highest measured daily consumption and the corresponding date.
When you selected a period: the diagram shows the highest total consumption. This value is calculated as follows: <highest measured daily consumption> multiplied by <number of days of the period>.
The [Consumables] amounts below the diagrams show the absolute amounts of consumables used during the selected period.