
The [Devices overview] app allows you to see the overview of your devices that are registered in PRISMA Home.
Please take into account that when receiving data for a printer for the first time, there may be a slight discrepancy in the click count displayed on the dashboard. This is because the initial print count may differ slightly from what is recorded in the cloud. However, rest assured that starting from the next day, the dashboard will accurately reflect the number of printed sheets and clicks.
To open the app, click the app menu and select [Devices overview].
There are three selection options in the [Devices overview] app.
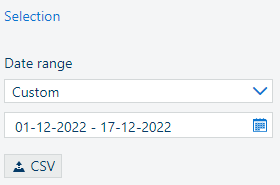
You can select a predefined period or define a custom period for which you want to display the information.
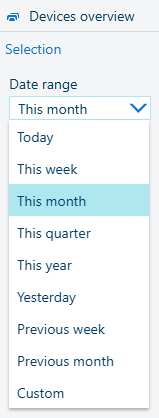 [Date range]
 You can view the devices all at once to compare the performance of devices. You can also click a specific device to view more detailed information about this device.
 All devices view
When you have selected a specific device, you can switch between the views: [Details] view, [Trends] view, [Timeline] view, and [Media] view.
You can export the data of all devices in the [Devices overview] as a CSV file. To export the data, click the
![]() [Export to CSV] button.
[Export to CSV] button.
 [Export data to CSV]
 The CSV file contains data per day for the selected interval. The data is raw, and the metric system of measurement is used.
The measurement units in the exported CSV file are as follows:
|
Measurements |
Units |
|---|---|
|
Duration attributes (any) |
Seconds |
|
Printed square meters |
Square meters |
|
Clicks attributes (any) |
TACs |
|
Consumables attributes (any) |
or
|
|
Calibrations |
Number of calibrations per day |