
PRISMAcolor Manager provides easy-to-understand overviews that allow you to validate the color quality and compare printed colors across multiple printers, including non-Canon printers. These overviews are available in the [Validation results] app.
During a color validation test, the measured values are compared to the tolerance levels. On the basis of this comparison, the quality level is assigned.
When the quality level is specified with a letter (from A to E), the quality level is within specifications and the color standard is met. Therefore, the test is [Passed] successfully.
A is the highest quality level.
When the quality level is shown in red, the quality level is not achieved and the color standard is not met. Therefore, the test [Failed] .
In the [Filters] section, you can filter the information that you want to see in the graphs and reports.
You can select the following:
[Date range];
[Test name];
[Printer];
[Test specification];
[Substrate].
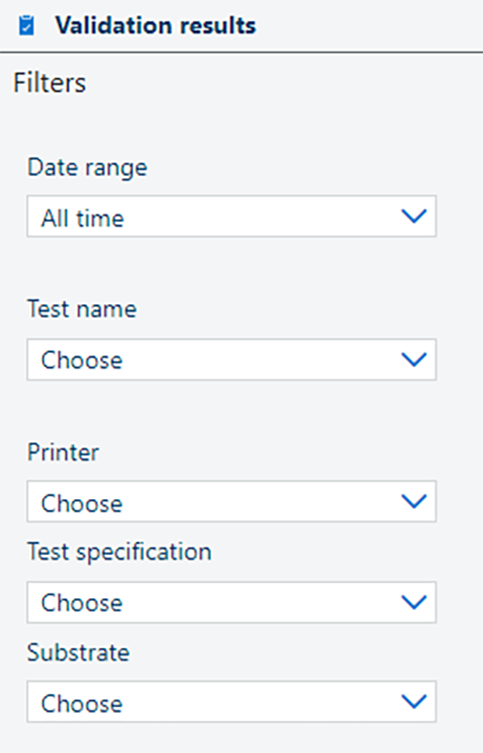 [Filters] filters
If you want to clear the filters, click the [Reset selection] button.
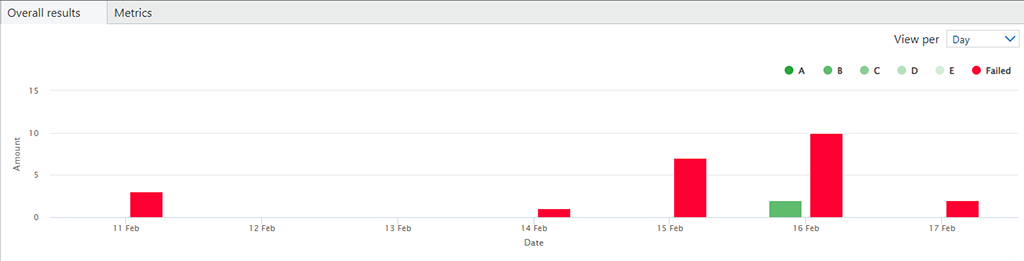 [Overall results] viewed per day
The [Overall results] view shows the validation results over a period of time. You can see the results per day, week, month or year. It is also possible to view the tests that reached a particular quality level.
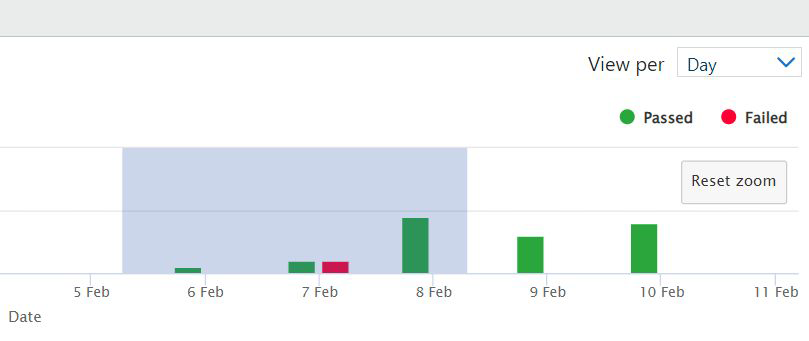
When the available data set is large, the graphical representation gets crowded. You can reduce the amount of data on the graph by zooming.
You can zoom in using the mouse gesture double-click followed by selecting a rectangular area on the graph. Repeat the zoom operation until you are satisfied.
Press the [Reset zoom] button to eliminate the zoom factor entirely.
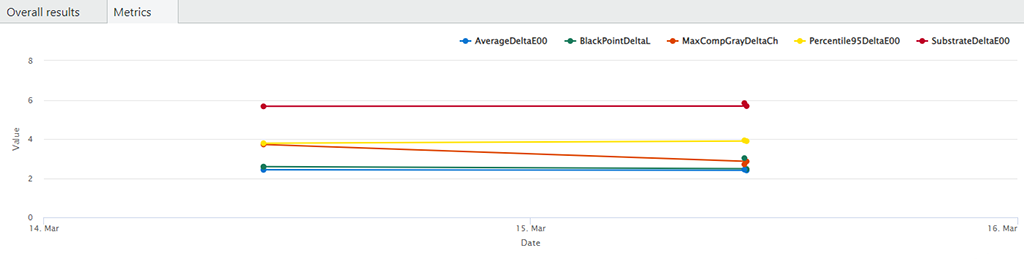
In the [Metrics] view, you can see more detailed information on a specific metric. To see the metrics graph, you need to select at least one test for which you want to see the data.
If you select more than one test, you must select the tests that have the same test specification.
In the [Metrics] view, you can select one of the metrics to open the [Validation comparison] app.
Press the button
![]() located in the last column of the list. The button is only visible when the mouse cursor hovers above the table row. The [Validation comparison] will have the relevant reference values filled in.
located in the last column of the list. The button is only visible when the mouse cursor hovers above the table row. The [Validation comparison] will have the relevant reference values filled in.
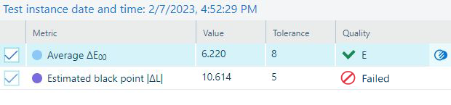
In the [Test instances] table, you can see an overview of performed validation tests, their status (green icon if the test was passed successfully and red if the test failed) and quality level. To add or remove columns with the information about the test reports, click the
![]() icon. The following information about the tests is available:
icon. The following information about the tests is available:
[Availability];
[Comments];
[Date and time];
[ID short code];
[Printer];
[Quality level];
[Substrate];
[Test name];
[Test specification].
You can open or download the test results as a PDF.
Delete the [Test instances] you no longer need.
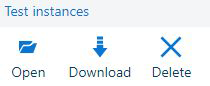 Buttons in the toolbar of the [Test instances] table